
PLOT_PX/XPS: a C Graphic Library Package, Part 2
Part 1 of this article was an introduction to PLOT_XPS, a graphic library that lets you generate PostScript files from your X applications. Here, in part 2, we look at what you can actually do with the library. The drawing functions of PLOT_XPS allow users to draw lines or write text in a screen window, a PS file or both.
PLOT_XPS draws lines of any color or width. Three predefined gray pens are available (black, dark gray and light gray). You can use the command ps_pen() to switch between them easily, but the function ps_gray() can change the default gray shade. The ps_rgb(), ps_hls() and ps_cymk() functions change the default pen color if you want something other than gray. The default line width can be modified using ps_line_width(), giving the width in picas or fractions of picas (PS units corresponding to 1/72th inch or 0.35 mm). All coordinates are stored with one digit after the decimal point, leading to a precision of 0.035 mm. This is better definition then the current 600 dpi (corresponding to 0.042 mm per dot) found on high quality laser printers. Once the default grey or the color and the line width are selected, all subsequent graphics and texts will use it.
Polylines are drawn using ps_polyline(), with x and y coordinates in two separate arrays. Complex polygonal surfaces can be drawn using ps_closed_curve(). Its only difference from the polyline drawing is the curve closing and the possibility to fill it the shape and contour it. Simple empty of filled circles, arcs or ellipses are created using the appropriate function, as well as rectangular frames. The following small program traces two sets of circles and ellipses, of different grey shades:
#include <stdio.h>
#include <plot_xps.h>
main()
{
        int j;
        ps_iniplot(0,"cercle.ps",0,0,0.,0.,1.,"");
        ps_origin(7.,5.,0.,0.) ;        /* go 7 cm right and 5 cm up */
                                                /* circles drawing */
        ps_disk(.25,0.);                        /* draws a disk */
        for(j = 0; j < 4; j++)
        {
                ps_circle((float)j);    /* draws 4 circles */
                ps_movea(0.,2.);                /* go 2 cm up */
        }
        /* drawing of ellipses */
        ps_ellip_disk(.5,.25,.6);        /* draws a grey ellipse */
        for(j = 0; j < 4; j++) /* and 4 ellipses */
        {
                ps_ellipse((float)j,(float)j/2.);
        }
        ps_endplot('f');                        /* keep the file */
} /* main */
The output of this program is shown in Figure 1.
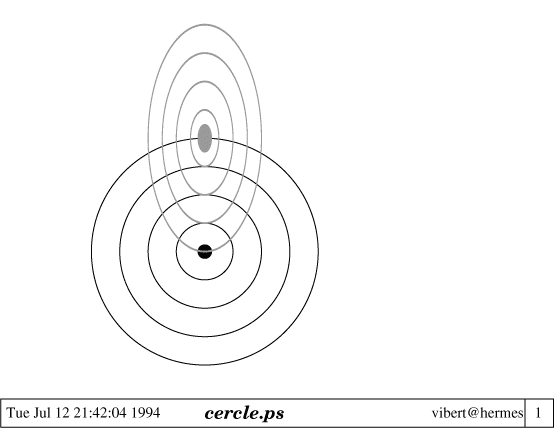
Figure 1. Output of the Circle Program Example
Higher level functions are devoted to complex graphs. ps_ticked_axes, for example, draws a x-y reference with two ticked axes. The axes are drawn from the current position, X axis first. Thus, the given minimum value always is considered as being at the current position. When the tick marks are not provided from the minimum value of the axes, this minimum value is the axis beginning. This allows users to draw graphs slightly shifted from the axes. In addition, a frame can be drawn around the graph that appears to be drawn inside a rectangle, with the lower and left sides ticked. The ticked marks are automatically computed to place small ticks every 1/10 of a unit, medium ticks at 1/2 unit multiples and large ticks at 1 unit multiples.
Figures, then. are annexed to the large ticks. The axes can cross at values other than 0.,0., indicated in user units. In addition, the ticked part can be shorter than the axis itself. Figures annexed to large ticks can be formatted using a standard C printf format, which defaults to "%.2f".
A previous call to ps_font() allows users to choose the font of the legends. Figure 2 shows an example of a rotated graph, where the ticked axes have their origins at -1, -1 and cross 5 mm below their origin. This lets the curves shift slightly from their axes. Related functions ps_x_axis and ps_y_axis do the same thing, but only in one direction, x or y. They always begin at the current position.
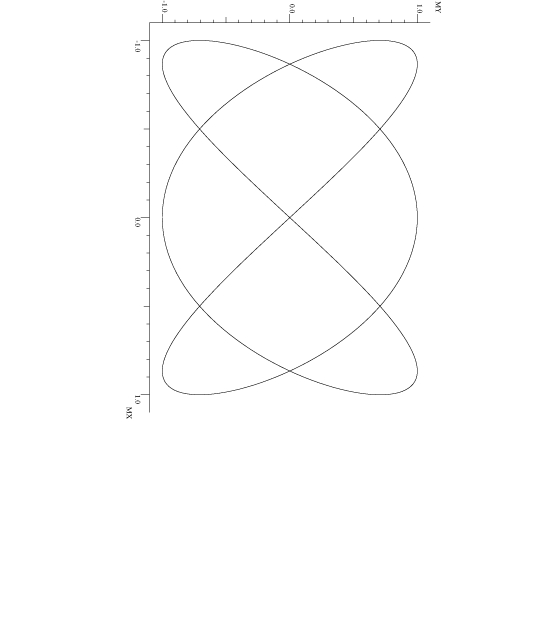
Figure 2. Example of ps_ticked_axes Output
ps_histo draws the histogram of values stored in a given array of integers. A flag indicates if statistics must be computed and written on the drawing. In this case, the mathematic library must be loaded when linking the task. According to the directions in the flag, some statistics are computed and drawn on the axis, including mean, standard deviation and mean number of events.
PLOT_XPS writes text, using the existing current gray or color ink, with the current font. Text can be placed anywhere on the drawing board with the needed slanting, the needed size and the needed rotation. The character sizes are always given in centimeters. All the local printer available PS fonts can be used. Nevertheless, if special fonts are needed, it is necessary to indicate in the plot_xps.fonts file the name of the corresponding X font. You then need to recompile and rebuild the PLOT_XPS library. A large collection of text- or value-writing functions are available, from the simplest ps_write("string"), which uses the default font and size, to the most complex ps_chars(), which writes a string of a given size using a relative or absolute coordinate value in user space. Default font and size are chosen using ps_font() and ps_size() respectively, and the color is the current color. Note that X does not text to be placed in any direction other horizontal and left to right or right to left. PLOT_XPS, however, allows users to write in any direction, because it reproduces PS behavior on the screen.
PLOT_XPS avoids the tedious computations necessary when 3-D drawings are needed. The user defines only the observation point of the space where the drawing board projection is performed. A specialized function then computes this projection from the data coordinates in the 3-D space. The following source code draws 27 cubes, with 1 cm sides, arranged as a 3x3x3 cubic matrix. The corresponding PS file output is shown in Figure 3.
#include <stdio.h>
#include <math.h>
#include <plot_xps.h>
main()
{
        int i, j, k;
        ps_iniplot(NULL,"cubes.ps",     /* open a file cubes.ps and a
window */
                        10,10,          /* called my_window located at
10,10 on */
                        21,.29.7,               /* the screen, with an
A4 sheet size, */
                        .5,                     /* scaled at half size,
without previous */
                        "My_window");   /* display open (NULL arg. in
position 1 */
        ps_cms();                               /* work in centimeters
*/
        ps_origin(7.,7.,0.,0.);         /* go to x=7cm, Y=7cm,
                                                 * and set here the new
                                                 * origin
                                                 */
                        /*
                         * Set up the 3D orientation and perspective
                         */
        ps_3Dsetup(10.,10.,10.,         /* length of the 3 axes */
                        0.,10.,         /* min max of x user values */
                        0.,10.,                 /* min max of y user
values */
                        0.,10.,                 /* min max of z user
values */
                        M_PI/4.,M_PI/3.,        /* angle and phi */
                        15.,10.);               /* distances ref-screen,
eye-screen */
                /*
                 * Draws the 27 cubes using 3 nested for loops
                 */
        for (k = 0 ; k < 3 ;k++)
                for (j = 0 ; j < 3 ;j++)
                        for ( i=0;i < 3;i++)
ps_3Dbar(2.*(float)(i)+1., /* [xyz] cordinates */
                                           2.*(float)(j)+1., /* of the
*/
                                           2.*(float)(k)+1., /* origine
of the bar */
                                           1.,1.,1.,            /* 3
side lengths */
                                           1); /* draws an outline */
        ps_endplot('s'); /* spools and keeps the PS file*/
}/* end of main */
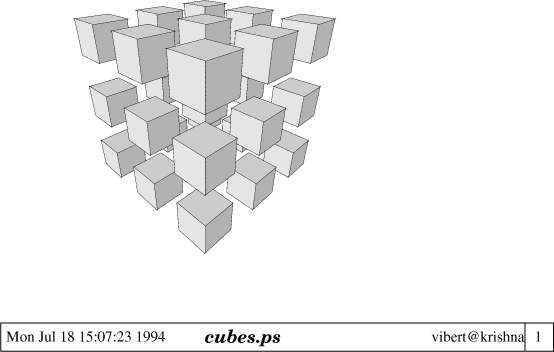
Figure 3. Output of the 3-D Program Example
The PLOT_XPS library is written in fully prototyped ANSI C language. Sources are distributed among eight different files: plot_xps.h (the header file), plot_xps.fonts (the list of available fonts), plot0_xps.c, plot1_xps.c, plot2_xps.c, plot3_xps.c, plot3d_xps.c and plotx_xps.c (the function sources). Each source file includes the man page formatted for get_tex, a public domain program that extracts LaTeX files from a prepared source file (get_tex is included in the distribution).
The plot_xps.h, the header file, should be stored in the default system include directory. This file must be included in each program that uses the PLOT_XPS library. The header file defines all the global variables shared by the functions and the user program, as well as the symbolic constant and the function prototypes.
The plot0_xps.c file contains all the lowest level functions. These are the only functions that actually write in the PS file. They are not documented in the manual, because they can be called only by the other PLOT_XPS functions.
Below are descriptions of the functions that transform user scales or centimeters into PS units. Also described are the functions that compute rotations, change origins, write texts and so on.
plot1_xps.c contain all the functions for initializing and closing the entire system--initialization of the system, first window opening if in PLOT_XPS, closing and spooling the files (or not, according to the arguments), etc. All font selection functions are collected in these files as well. Scale selection, origin translation and settings are in the file, along with rectangle, circle, arc, disk and ellipse drawing functions.
The plot2_xps.c file contain all the functions that control pen movements, text writing, line and color selection, dot selection and so on. Namely, the functions that let users make simple drawings, line after line, are contained here.
The plot3_xps.c file contains all the functions that allow high level drawing using one function call. Ticked axis drawing, histograms, polylines, curves, closed curves, bezier curves and function are stored in these files.
The plot3d_xps.c file contain all the functions to create 3-D drawings, from the 3-D axes up to the 3-D projection of any curve or dot collection. If these functions are used, it is necessary to link the program with the math library.
The plotx_xps.c file contains all the X functions for writing in an X window. In fact, all the X functions are collected in this file. Some are private and cannot be called by the user, mainly because they are static and only in the name space of the PLOT_XPS functions. They represent the lowest level for X library access. The plot0_xps functions use these functions to write in the windows as well as in the PS files. The other X-related functions are callable and documented, and they mainly concern the opening, choosing and closing of new windows (the first window is opened when initiating the whole system). PLOT_XPS only uses the basic Xlib and, thus, does not rely on any X toolkit or X-specific widgets. DEC, Athena or Motif toolkits are not necessary to use PLOT_XPS, giving the user independent status.
The total source code for PLOT_XPS is approximately 9,000 lines of C. PLOT_XPS was compiled and tested on UNIX systems (Linux, Ultrix, OSF, Digital Unix, Tru64, AIX, SunOS and Solaris) and on VMS and Open VMS systems.
A second library, called PLOT_PS, also is available for those not interested in the manipulation of several PS files or in X system access. PLOT_PS proposes exactly the same graphic routines, but it does not provide the functions specific to window management. All the function calls are exactly the same for all routines, except for two--ps_iniplot and ps_endplot--that don't need references to Displays. Nevertheless, most of the function code is completely different.
On an ASCII terminal without an X11 environment, a C program will be linked using PLOT_PS like this:
cc -o my_prog my_prog.c -lplot_ps -lm
The Makefile should look like:
LIBS = -lplot_ps -lm
cc -o my_program my_program.c $(LIBS)
PLOT_PS represents 5,400 lines of C and is distributed among seven different files: plot_ps.h (the header file), plot0_ps.c, plot1_ps.c, plot2_ps.c, plot3_ps.c, plot3d_ps.c and plotcol_ps.c. The last file contains all the functions related to color processing.
We have used PLOT_PS since 1985 in applications for information analysis in neuroscience and computational biology. As of this writing, it is at version 6.4. The X version, PLOT_XPS, was developed in 1991. PLOT_PS and PLOT_XPS are still used to produce our working documents, as well as most of the figures for our research papers.
Parts of these libraries were developed by three of my former students. Jean-Noël Albert was the developer of a library for a Benson plotter, from which I later wrote the PLOT_PS library. Sylvain Hanneton wrote a large number of high level functions, and Eric Boussard wrote the X11 implementation of the PS functions (the plotx_xps.c module). All are warmly acknowledged for their contribution. The configure wraparound and some bug fixes were made by Bastien Chevreux.
PLOT_PS and PLOT_XPS were compiled and tested on several UNIX systems (Linux, Ultrix, OSF, Digital Unix, Tru64, AIX, SunOS and Solaris), on VMS and Open VMS systems and on MS/DOS. Both libraries are distributed under the LGPL with the source code. They are regrouped in a tarball file, plot_psxps-6.4.1.tar.gz, which is available on SourceForge. A configure, make and make install setup is provided, and the installation is completely automatic. For VMS users, a DCL command file is included, as is a MS-DOS batch file for Windows users. Two full manuals are supplied (57 pages for PLOT_PS, 88 pages for PLOT_XPS), in TeX, PS and HTML. A CVS site is provided on SourceForge for those who want to contribute and add more functions.
Jean-François Vibert is an MD and neuroscientist who develops programs for his research needs in the field of computational neurosciences. He's been the co-chairman of DECUS France for 15 years, and he released many C and UNIX programs in the public domain through the DECUS library. He teaches C programming to students in biomathematics at the School of Medicine Saint-Antoine, in Paris.
email: vibert@u444.jussieu.fr
