
PLOT_PS/XPS: a C Graphic Library Package, Part 1
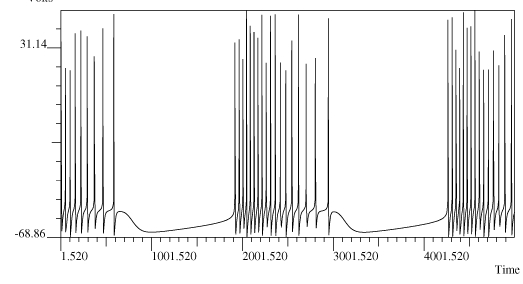
Almost any data analysis benefits from graphic outputs. They often lead to a more affordable and synthetic view of results than any table can provide. To meet this type of need, we developed a graphic library that easily produces high quality printouts using the PostScript (PS) language. Because UNIX/Linux graphic workstations are now widespread, it also appeared necessary to produce on-screen graphics using the X Window System. But programming X is not a trivial task and requires painful training. Moreover, it provides only crude, low-level graphic routines (dots, lines, rectangles and arcs). No hard copy output can be had from the X library, Xlib. The only way to reproduce a window's content is to make a pixmap screen dump, which produces low-quality hard copy. Figures 1a and 1b compare both ways of printing a graph. Our example graph represents the bursting behavior of a simulated neuron produced by a program using the PLOT_XPS library. The figures display the screen capture of the window produced, and the graph simultaneously produced by the same program by plotting the generated PS file.

Figure 1a.
PLOT_XPS outputs. Upper part: screen capture of a drawing representing the membrane potential temporal evolution of a bursting neuron. Lower part: the corresponding PostScript drawing. Note the hatched aspect of the line between bursts on the screen output compared to the smooth line on the printed counterpart.
In this article, we describe two sister graphic libraries written in C for C/C++ programmers. PLOT_XPS allows users to manage up to ten X windows without any X programming and, simultaneously, to produce up to ten high quality PostScript graphic files, all using simple C function calls. A subset, called PLOT_PS, is simpler and produces a single graphic PostScript file. It is not necessary to know neither the PostScript language nor X programming to use these libraries. Both libraries propose exactly the same graphics routines, but PLOT_PS does not provide functions specific to the window management.
PLOT_XPS is original compared to other graphic libraries, and it should not be seen as another PostScript driver. It makes things easier for the C programmer who only needs to produce graphics on screen, as well as high quality hardcopy. With PLOT_XPS, users don't need to know about removing asynchronous pointing device interaction, nor do they have to learn X programming.
PLOT_XPS provides low level functions (pen moving, line drawing, etc.) as well as high level functions (ticked axes, 3-D representations, histograms, animations). Because PLOT_XPS is an open-source library, any high level function can be added by the user in order to enrich the library. A full manual, written in LaTeX, is included and distributed in LaTeX, PostScript and HTML.
For the rest of this article, both part 1 and part 2, we will describe the graphic model used, the general organization of the library, the main functions and the X library extension, as well as the library implementation.
The graphic model used in PLOT_XPS is simple and rather classical. A virtual pen is used draw actual lines in absolute coordinates (x and y are true coordinates in the paper space) or relative coordinates (x and y are coordinates relative to the last pen position in the paper space). With the provided primitives, it is then possible to make vector and polygon (empty of filled) drawings, text drawings with multiple fonts and sizes, texts and graphics that rotate and scale, axis drawings, 3-D vector and surface drawings, and the list goes on.
To facilitate the drawing of graphs, two parallel coordinate spaces coexist on the drawing area: the paper space and the user space. The paper space unit is always the cm. The user space unit can be defined at will, in order to translate the user units into centimeters. This brings the possibility of switching instantaneously from cm to user units (the user's scale). The coordinates origin is the lower left corner of both the paper sheet and the X window. The X axis grows toward the right and the Y axis growth toward the top. Coordinates' origins can be modified during the drawing. Lines can be drawn at any width and in any greyshade or color. Texts can be written using a PostScript font, and they can be any size and in any rotation. All attributes, such as color, line width, font, text size and so on are set by default values until their values are explicitly modified.
The PLOT_XPS functions can be divided into the following: preparation functions i(initialization, scaling, rotation, origin, etc.); moving and drawing functions (move, draw, rectangle, circle, etc.); attribute setting functions (line width, fonts setting, color, etc.); and informative functions (where is the pen, what window is active, what is the current color, etc.).
As this library produces PostScript files, it takes advantage of the language. This means the graphic space can be translated, rotated or scaled on both PostScript printouts and X screenviews. It is possible to comment the produced PostScript code, to include PostScript statements and to include an already existing PostScript file in a newly generated file. Nevertheless, since PLOT_XPS does not implement a PostScript interpreter, the included PS code is not displayed in the X window. It is included only in the output PS file and consequently is processed by either the PostScript previewer or by the PS printer.
PLOT_XPS can make color drawings, using the three usual color models: red-green-blue (RGB), cyan-yellow-magenta- black (CYMK) or hue-light-saturation (HLS) models.
PLOT_XPS allows users to simultaneously open up to ten X windows, whose sizes are given when the windows are created. Each window can have an associated PS file, in which a hardcopy of this window will be recorded. The window can be displayed or hidden at will. The hardcopy record can be stopped and started at will, useful if some parts of the on-screen display don't have to be printed. Window images can be concatenated dynamically to produce an animated, movie-like drawing. In such cases, the window hardcopies should be disabled in order to speed up the drawing and to avoid printing all the intermediate images.
PostScript and X are two very different systems, opposite in many respects. This divergence caused difficulties regarding simultaneous production of the same graph from a single source. X considers the origin of the coordinates as the upper left corner of the window, with the Y axis growing toward the bottom. PostScript, on the other hand, considers the coordinates' origin as the lower left corner of the paper sheet, with the Y axis growing up. Both have the X axis growing from left to right. The PS accuracy depends only on the PS printer's number of dots per inch, and it can be quite precise (1200 dpi is a feature on most printers, even low price ones). But X is limited by the screen pixel size.
Nevertheless, the more important difference is management philosophy. X is event driven, while PS is sequential. The challenge was to display a sequential graph in a window that normally reacts only to events, while at the same time managing window overlapping, exposures and resizing. Normally, when a window is momentarily overlapped or hidden by another one, an expose event is sent when it reappears, and the program must redraw the previously masked drawings. In other words, the program must remember what was on screen. In the sequential PS drawing, all past drawings are forgotten, since they are supposed to be printed out. Moreover, PS ink is opaque and redrawing above a previous printing modifies it.
We solved this problem by writing to a pixmap instead, using the window itself as a drawable surface. This avoids the need to remember or store all previously drawn segments. It appears that flushing each elementary drawing carries a very slow response time when a lot of small elementary graphic elements are drawn and flushed, which happens once the high level function call becomes too slow. For these reasons, we chose to use a timer to refresh the screen (i.e., flush the pixmap) periodically. We have set this timer to 0.3s, which appeared to be a good compromise between display speed and flickering. The problem of the expose was solved by setting the window background as the drawing pixmap. Using this trick, the program does not have to process the expose events, because they are processed automatically by the window manager. It becomes the window manager's job to flush the background pixmap on the previously hidden window and to redisplay it at each new exposure. This avoids having to take into account exposure events, because they are managed by the local window manager, which automatically redraws the background pixmap and, consequently, the graph.
X allows only horizontal (left to right or right to left) writing, while PS allows users to write in any direction. This was mimicked by extracting the X character from the needed font, writing it on a small pixmap and then rotating it in the whole pixmap.
In order to have an exact mirror copy of the associated PS file contents, whenever a window is created, the user chooses the position of the window on the screen, a window size and the drawing scale factor. Since no memory of the past drawing is kept and only the opaque ink printed graph (already painted on the background screen) is available in the PostScript model, the resizing events were not possible to process correctly. Shrinking the window could have been done using the XShrinkRegion function, but a subsequent enlarging would have greatly degraded the background graph. For this reason, the resizing of windows opened by PLOT_XPS is disabled and the window size cannot be modified. Instead, the default window size can be chosen when the library is built. We use the European standard A4 form sheet (2x29.7 cm), with a scale factor of 1.
PLOT_XPS is a set of C functions designed to build PostScript files and to possibly display the same drawings from C programs in X. All functions begin with the prefix ps_, and the program needs to have the plot_xps.h header file included. Before drawing any function call, the whole system must be initialized, and the coordinates origin and their scales must be defined. Then the drawing can begin. When it is finished, the whole system must be deactivated in order to cleanly close the open PS files.
Thus, the first function to be called is ps_iniplot. It opens both the PS file and the first X window with the specified size. If necessary, both can be dissociated; that is, you can get only the PS file or only an X window. ps_iniplot can be called from a normal X program, because it allows users to indicate the X server display where the created windows should be sent. If called from a non-X program, ps_iniplot takes care of all the display preparation. It writes in the PS file comments indicating the PLOT_XPS version, the file name, the date, and the user and host identifiers. It then redefines some PS commands in order to reduce the size of generated PS files. Next, it writes a flag at the bottom of the page listing the date, file name, user name and the page number. This flag is delimited with comments in order to be easily recognized if it is necessary to remove it. This flag is normally drawn on each page of the generated PS file, but it can be eliminated by a function (ps_no_banner).
The next functions to call allow users to define the coordinate origin (ps_origin). This generally is followed by the scaling factor setting ( ps_echel), which defines the user space with the possibility to make a general rotation of the whole graph. PLOT_XPS allows users to work in both paper (in cm) and user space. The switch from one space to another is done using ps_cm or ps_user. To work in the user space, the function ps_echel must be called in order to define this user space.
Then the graphic or text drawing can begin. The pen movement functions are ps_movea or ps_mover, for absolute or relative movings, and ps_drawa or ps_drawr, for absolute or relative drawings. These are the simplest functions, but a large collection of higher level functions also is available, from the simple rectangle (ps_frame) to the whole histogram (ps_histo). 3-D drawings are also available, after a call to the ps_3Dsetup function, which sets up all the necessary 3-D parameters.
New windows and the corresponding PS files (up to ten) can be opened or closed during the program execution with the ps_create_window and ps_close_window commands. (PS_MAX_WINDOW_NUMBER can be opened simultaneously.) A name is associated with each newly created window. After that point, the windows always are referred to by these name. All operations are performed on the currently selected window by using ps_use_window. Windows can be hidden temporarily (ps_hide_window, ps_display_window, ps_toggle_visibility). In addition, window drawing can be disabled and re-enabled during the session (ps_no_display, ps_display) and during printing (ps_no_print, ps_print). Several functions provide information on the current state of either a window, a print job, etc.; they have the generic prefix ps_is_*() and return a Boolean.
If the PLOT_XPS functions are called by a program already using the X11 library, the PLOT_XPS windows can be associated with an existing display. This way they can be fully integrated and managed with the other parts of the application.
Inclusion of PS files or plain PostScript code is possible with PLOT_XPS. The file inclusion possibility allows the inclusion of a drawing obtained with any WYSIWYG interactive drawing program that produces encapsulated PostScript files. As stated previously, the resulting graph will be included only in the output PS file.
The very last function call must be ps_endplot. It closes the PostScript files and spools them (or not, according the given argument), closes all remaining windows and makes the necessary housekeeping before stopping the X connection. If a Control-C is typed, the session is trapped--all the necessary memory freeing is done, windows are closed, files are saved and a clean exit is performed.
The following listing gives an example of a very small program, one that draws a square and a rectangle:
#include <stdio.h>
#include <plot_xps.h>
main()
{
        ps_iniplot(NULL,"my_file.ps",   /* open a file my_file.ps and a window */
                        10,10,          /* called my_window located at 10,10 on */
                        21.,29.7,               /* the screen, with an A4 sheet size, */
                        .5,                     /* scaled at half size, without previous */
                        "My_window");   /* display open (NULL arg. in position 1 */
        ps_origin(10.,10.,0.,0.);       /*
                                                 * move the pen at 10.,10. cm relative
                                                 * to the lower left corner of the page
                                                 * (+ 2cm in Y direction due to the
                                                 * banner), and set this position as the
                                                 * new origin
                                                 */
        ps_echel(0.5,0.5,0.,0.,1.,0.);/*
                                                 * set the scale as 1 user unit for
                                                 * 2 cm, drawing head up
                                                 */
        ps_user();                      /* works in user space */
        ps_movea(1.,3.);                /* go to x=1., y=3. */
        ps_drawr(2.,0.);                /* and draws a 2 units sided square */
        ps_drawr(0.,-2.);
        ps_drawr(-2.,0.);
        ps_drawa(1.,3.);
        ps_cms();                       /* work in cm */
        ps movea(5.,5.);                /* go to x=5.cm, Y= 5.cm */
        ps_frame(6.,3.);                /* draws a rectangle
                                         * 6. cm of X width,
                                         * and 3. cm of Y height
                                         */
        ps_endplot('d');                /* closes, spools and deletes the file */
}
The resulting simple plot is shown in Figure 2.
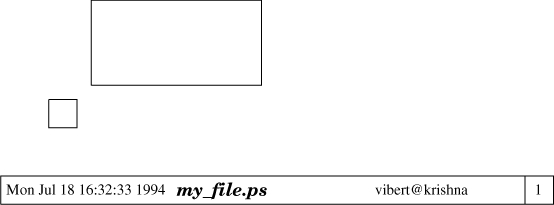
Figure 2:
The plot obtained with the first simple program. The bottom rectangle is drawn automatically on each sheet (it can be removed). It acts as a flag page indication, from left to right: the PS file date creation, the file name, user and and host name and the page number. The PS drawing is plotted above these indications.
The program using PLOT_XPS must be linked with the PLOT_XPS and the X11 libraries. If 3-D functions are used, the program also must be linked with the math library. Under UNIX for example, a program running in an X11 environment would be linked using the PLOT_XPS library as follows:
cc -o my_prog my_prog.c -lplot_xps -lX11 -lm
and the Makefile should look like:
LIBS = -lplot_xps -lX11 -lm
cc -o my_program my_program.c $(LIBS)
In part 2 of this article, we'll get into the drawing functions, including drawing lines, curves and 3-D plots. We'll also discuss implementation.
Jean-François Vibert is and MD and neuroscientist who develops programs for his research needs in the field of computational neurosciences. He's been the co-chairman of DECUS France for 15 years, and he released many C and UNIX programs in the public domain through the DECUS library. He teaches C programming to students in biomathematics at the School of Medicine Saint-Antoine, in Paris.
email: vibert@u444.jussieu.fr
