
Oops! Debugging Kernel Panics
A look into what causes kernel panics and some utilities to help gain more information.
Working in a Linux environment, how often have you seen a kernel panic? When it happens, your system is left in a crippled state until you reboot it completely. And, even after you get your system back into a functional state, you're still left with the question: why? You may have no idea what happened or why it happened. Those questions can be answered though, and the following guide will help you root out the cause of some of the conditions that led to the original crash.
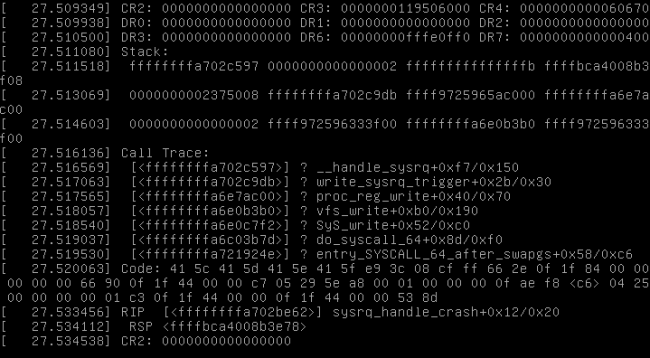
Figure 1. A Typical Kernel Panic
Let's start by looking at a set of utilities known as
kexec and kdump. kexec allows you to boot into
another kernel from an existing (and running) kernel, and
kdump is a
kexec-based crash-dumping mechanism for Linux.
First and foremost, your kernel should have the following components statically built in to its image:
CONFIG_RELOCATABLE=y
CONFIG_KEXEC=y
CONFIG_CRASH_DUMP=y
CONFIG_DEBUG_INFO=y
CONFIG_MAGIC_SYSRQ=y
CONFIG_PROC_VMCORE=y
You can find this in /boot/config-`uname -r`.
Make sure that your operating system is up to date with the latest-and-greatest package versions:
$ sudo apt update && sudo apt upgrade
Install the following packages (I'm currently using Debian, but the same should and will apply to Ubuntu):
$ sudo apt install gcc make binutils linux-headers-`uname -r`
 ↪kdump-tools crash `uname -r`-dbg
Note: Package names may vary across distributions.
During the installation, you will be prompted with questions to enable
kexec to handle reboots (answer whatever you'd like, but I answered
"no"; see Figure 2).
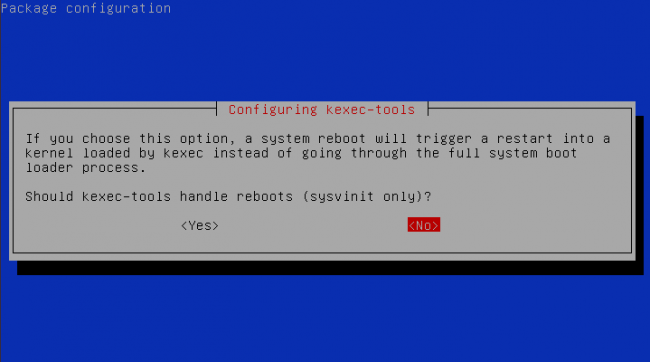
Figure 2. kexec Configuration Menu
And to enable kdump to run and load at system boot, answer
"yes" (Figure 3).
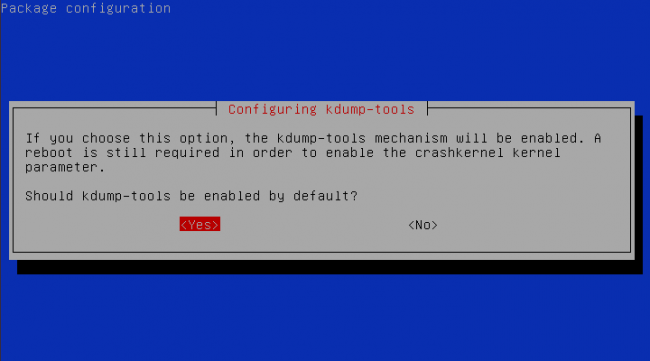
Figure 3. kdump Configuration Menu
Configuring kdumpOpen the /etc/default/kdump-tools file, and at the very top, you should see the following:
USE_KDUMP=1
#KDUMP_SYSCTL="kernel.panic_on_oops=1"
Eventually, you'll write a custom module that will trigger an OOPS kernel
condition, and in order to have kdump gather and save the state of the
system for post-mortem analysis, you'll need to enable your kernel to
panic on this OOPS condition. In order to do this, uncomment the line
that starts with KDUMP_SYSCTL:
USE_KDUMP=1
KDUMP_SYSCTL="kernel.panic_on_oops=1"
The initial testing will require that SysRq be enabled. There are a few ways to do that, but here I provide instructions to enable support for this feature on system reboot. Open the /etc/sysctl.d/99-sysctl.conf file, and make sure that the following line (closer to the bottom of the file) is uncommented:
kernel.sysrq=1
Now, open this file: /etc/default/grub.d/kdump-tools.default. You will find a single line that looks like this:
GRUB_CMDLINE_LINUX_DEFAULT="$GRUB_CMDLINE_LINUX_DEFAULT
 ↪crashkernel=384M-:128M"
Modify the section that reads crashkernel=384M-:128M to
crashkernel=128M.
Now, update your GRUB boot configuration file:
$ sudo update-grub
[sudo] password for petros:
Generating grub configuration file ...
Found linux image: /boot/vmlinuz-4.9.0-8-amd64
Found initrd image: /boot/initrd.img-4.9.0-8-amd64
done
And, reboot the system.
Verifying Your kdump Environment
After coming back from the reboot, dmesg will log the
following:
$ sudo dmesg |grep -i crash
[    0.000000] Command line: BOOT_IMAGE=/boot/vmlinuz-4.9.0-8-amd64
 ↪root=UUID=bd76b0fe-9d09-40a9-a0d8-a7533620f6fa ro quiet
 ↪crashkernel=128M
[    0.000000] Reserving 128MB of memory at 720MB for crashkernel
 ↪(System RAM: 4095MB)
[    0.000000] Kernel command line: BOOT_IMAGE=/boot/
↪vmlinuz-4.9.0-8-amd64
 ↪root=UUID=bd76b0fe-9d09-40a9-a0d8-a7533620f6fa ro
 ↪quiet crashkernel=128M
While your kernel will have the following features enabled (a "1" means enabled):
$ sudo sysctl -a|grep kernel|grep -e panic_on_oops -e sysrq
kernel.panic_on_oops = 1
kernel.sysrq = 1
Your kdump service should be running:
$ sudo systemctl status kdump-tools.service
 kdump-tools.service - Kernel crash dump capture service
   Loaded: loaded (/lib/systemd/system/kdump-tools.service;
    ↪enabled; vendor preset: enabled)
   Active: active (exited) since Tue 2019-02-26 08:13:34 CST;
    ↪1h 33min ago
  Process: 371 ExecStart=/etc/init.d/kdump-tools start
   ↪(code=exited, status=0/SUCCESS)
 Main PID: 371 (code=exited, status=0/SUCCESS)
    Tasks: 0 (limit: 4915)
   CGroup: /system.slice/kdump-tools.service

Feb 26 08:13:34 deb-panic systemd[1]: Starting Kernel crash
 ↪dump capture service...
Feb 26 08:13:34 deb-panic kdump-tools[371]: Starting
 ↪kdump-tools: loaded kdump kernel.
Feb 26 08:13:34 deb-panic kdump-tools[505]: /sbin/kexec -p
 ↪--command-line="BOOT_IMAGE=/boot/vmlinuz-4.9.0-8-amd64 root=
Feb 26 08:13:34 deb-panic kdump-tools[506]: loaded kdump kernel
Feb 26 08:13:34 deb-panic systemd[1]: Started Kernel crash dump
 ↪capture service.
Your crash kernel should be loaded (into memory and in the 128M region you defined earlier):
$ cat /sys/kernel/kexec_crash_loaded
1
You can verify your kdump configuration further here:
$ sudo kdump-config show
DUMP_MODE:        kdump
USE_KDUMP:        1
KDUMP_SYSCTL:     kernel.panic_on_oops=1
KDUMP_COREDIR:    /var/crash
crashkernel addr: 0x2d000000
   /var/lib/kdump/vmlinuz: symbolic link to /boot/
↪vmlinuz-4.9.0-8-amd64
kdump initrd:
   /var/lib/kdump/initrd.img: symbolic link to /var/lib/kdump/
↪initrd.img-4.9.0-8-amd64
current state:    ready to kdump

kexec command:
  /sbin/kexec -p --command-line="BOOT_IMAGE=/boot/
↪vmlinuz-4.9.0-8-amd64 root=UUID=bd76b0fe-9d09-40a9-
↪a0d8-a7533620f6fa ro quiet irqpoll nr_cpus=1 nousb
 ↪systemd.unit=kdump-tools.service
 ↪ata_piix.prefer_ms_hyperv=0"
 ↪--initrd=/var/lib/kdump/initrd.img /var/lib/kdump/vmlinuz
Let's also test it without actually running it:
$ sudo kdump-config test
USE_KDUMP:         1
KDUMP_SYSCTL:      kernel.panic_on_oops=1
KDUMP_COREDIR:     /var/crash
crashkernel addr:  0x2d000000
kdump kernel addr:
kdump kernel:
   /var/lib/kdump/vmlinuz: symbolic link to /boot/
↪vmlinuz-4.9.0-8-amd64
kdump initrd:
   /var/lib/kdump/initrd.img: symbolic link to
 ↪/var/lib/kdump/initrd.img-4.9.0-8-amd64
kexec command to be used:
  /sbin/kexec -p --command-line="BOOT_IMAGE=/boot/
↪vmlinuz-4.9.0-8-amd64 root=UUID=bd76b0fe-9d09-40a9-
↪a0d8-a7533620f6fa ro quiet irqpoll nr_cpus=1 nousb
 ↪systemd.unit=kdump-tools.service
 ↪ata_piix.prefer_ms_hyperv=0"
 ↪--initrd=/var/lib/kdump/initrd.img /var/lib/kdump/vmlinuz
The Moment of Truth
Now that your environment is loaded to make use of kdump, you
probably should test it, and the best way to test it is by forcing a
kernel crash over SysRq. Assuming your kernel is built with SysRq support,
crashing a running kernel is as simple as typing:
$ echo "c" | sudo tee -a /proc/sysrq-trigger
What should you expect? You'll see a kernel panic/crash similar to the one shown in Figure 1. Following this crash, the kernel loaded over kexec will collect the state of the system, which includes everything relevant in memory, on the CPU, in dmesg, in loaded modules and more. It then will save this valuable crash data somewhere in /var/crash for further analysis. Once the collection of information completes, the system will reboot automatically and will bring you back to a functional state.
What Now?You now have your crash file, and again, it's located in /var/crash:
$ cd /var/crash/
$ ls
201902261006  kexec_cmd
$ cd 201902261006/
Although before opening the crash file, you probably should install the kernel's source package:
$ sudo apt source linux-image-`uname -r`
Earlier, you installed a debug version of your Linux kernel containing
the unstripped debug symbols required for this type of debugging
analysis. Now you need that kernel. Open the kernel crash file with the
crash utility:
$ sudo crash dump.201902261006 /usr/lib/debug/
↪vmlinux-4.9.0-8-amd64
Once everything loads, a summary of the panic will appear on the screen:
      KERNEL: /usr/lib/debug/vmlinux-4.9.0-8-amd64
    DUMPFILE: dump.201902261006  [PARTIAL DUMP]
        CPUS: 4
        DATE: Tue Feb 26 10:07:21 2019
      UPTIME: 00:04:09
LOAD AVERAGE: 0.00, 0.00, 0.00
       TASKS: 100
    NODENAME: deb-panic
     RELEASE: 4.9.0-8-amd64
     VERSION: #1 SMP Debian 4.9.144-3 (2019-02-02)
     MACHINE: x86_64  (2592 Mhz)
      MEMORY: 4 GB
       PANIC: "sysrq: SysRq : Trigger a crash"
         PID: 563
     COMMAND: "tee"
        TASK: ffff88e69628c080 [THREAD_INFO: ffff88e69628c080]
         CPU: 2
       STATE: TASK_RUNNING (SYSRQ)
Notice the reason for the panic: sysrq: SysRq : Trigger
a crash. Also, notice the command that led to it:
tee. None of this should be a surprise since you
triggered it.
If you run a backtrace of what the kernel functions were that led to the panic, you should see the following (processed by CPU core no. 2):
crash> bt
PID: 563    TASK: ffff88e69628c080  CPU: 2   COMMAND: "tee"
 #0 [ffffa67440b23ba0] machine_kexec at ffffffffa0c53f68
 #1 [ffffa67440b23bf8] __crash_kexec at ffffffffa0d086d1
 #2 [ffffa67440b23cb8] crash_kexec at ffffffffa0d08738
 #3 [ffffa67440b23cd0] oops_end at ffffffffa0c298b3
 #4 [ffffa67440b23cf0] no_context at ffffffffa0c619b1
 #5 [ffffa67440b23d50] __do_page_fault at ffffffffa0c62476
 #6 [ffffa67440b23dc0] page_fault at ffffffffa121a618
    [exception RIP: sysrq_handle_crash+18]
    RIP: ffffffffa102be62  RSP: ffffa67440b23e78  RFLAGS: 00010282
    RAX: ffffffffa102be50  RBX: 0000000000000063  RCX: 0000000000000000
    RDX: 0000000000000000  RSI: ffff88e69fd10648  RDI: 0000000000000063
    RBP: ffffffffa18bf320   R8: 0000000000000001   R9: 0000000000007eb8
    R10: 0000000000000001  R11: 0000000000000001  R12: 0000000000000004
    R13: 0000000000000000  R14: 0000000000000000  R15: 0000000000000000
    ORIG_RAX: ffffffffffffffff  CS: 0010  SS: 0018
 #7 [ffffa67440b23e78] __handle_sysrq at ffffffffa102c597
 #8 [ffffa67440b23ea0] write_sysrq_trigger at ffffffffa102c9db
 #9 [ffffa67440b23eb0] proc_reg_write at ffffffffa0e7ac00
#10 [ffffa67440b23ec8] vfs_write at ffffffffa0e0b3b0
#11 [ffffa67440b23ef8] sys_write at ffffffffa0e0c7f2
#12 [ffffa67440b23f38] do_syscall_64 at ffffffffa0c03b7d
#13 [ffffa67440b23f50] entry_SYSCALL_64_after_swapgs at ffffffffa121924e
    RIP: 00007f3952463970  RSP: 00007ffc7f3a4e58  RFLAGS: 00000246
    RAX: ffffffffffffffda  RBX: 0000000000000002  RCX: 00007f3952463970
    RDX: 0000000000000002  RSI: 00007ffc7f3a4f60  RDI: 0000000000000003
    RBP: 00007ffc7f3a4f60   R8: 00005648f508b610   R9: 00007f3952944480
    R10: 0000000000000839  R11: 0000000000000246  R12: 0000000000000002
    R13: 0000000000000001  R14: 00005648f508b530  R15: 0000000000000002
    ORIG_RAX: 0000000000000001  CS: 0033  SS: 002b
In your backtrace, you should notice the symbol address of what is stored in
your Return Instruction Pointer (RIP): ffffffffa102be62. Let's take a look at this symbol address:
crash> sym ffffffffa102be62
ffffffffa102be62 (t) sysrq_handle_crash+18 ./debian/build/
↪build_amd64_none_amd64/./drivers/tty/sysrq.c: 144
Wait a minute! The exception seems to have been triggered in line 144
of the drivers/tty/sysrq.c file and inside the
sysrq_handle_crash function. Hmm...I wonder what's happening
in this kernel source file. (This is why I had you installed your kernel source
package moments ago.) Let's navigate to the /usr/src
directory and untar the source package:
$ cd /usr/src
$ ls
linux_4.9.144-3.debian.tar.xz  linux_4.9.144.orig.tar.xz
 ↪linux-headers-4.9.0-8-common
linux_4.9.144-3.dsc            linux-headers-4.9.0-8-amd64
 ↪linux-kbuild-4.9
$ sudo tar xJf linux_4.9.144.orig.tar.xz
$ vim linux-4.9.144/drivers/tty/sysrq.c
Locate the sysrq_handle_crash function:
static void sysrq_handle_crash(int key)
{
    char *killer = NULL;

    /* we need to release the RCU read lock here,
     * otherwise we get an annoying
     * 'BUG: sleeping function called from invalid context'
     * complaint from the kernel before the panic.
     */
    rcu_read_unlock();
    panic_on_oops = 1;      /* force panic */
    wmb();
    *killer = 1;
}
And more specifically, look at line 144:
*killer = 1;
It was this line that led to the page fault logged in line #6 of the backtrace:
#6 [ffffa67440b23dc0] page_fault at ffffffffa121a618
Okay. So, now you should have a basic understanding of how to debug bad kernel code, but what happens if you want to debug your very own custom kernel modules (for example, drivers)? I wrote a simple Linux kernel module that essentially invokes a similar style of a kernel crash when loaded. Call it test-module.c and save it somewhere in your home directory:
#include <linux/init.h>
#include <linux/module.h>
#include <linux/version.h>

static int test_module_init(void)
{
        int *p = 1;
printk("%d\n", *p);
        return 0;
}
static void test_module_exit(void)
{
        return;
}

module_init(test_module_init);
module_exit(test_module_exit);
You'll need a Makefile to compile this kernel module (save it in the same directory):
obj-m += test-module.o

all:
    $(MAKE) -C/lib/modules/$(shell uname -r)/build M=$(PWD)
Run the make command to compile the module and do
not delete any of the compilation artifacts; you'll need
those later:
$ make
make -C/lib/modules/4.9.0-8-amd64/build M=/home/petros
make[1]: Entering directory '/usr/src/
↪linux-headers-4.9.0-8-amd64'
  CC [M]  /home/petros/test-module.o
/home/petros/test-module.c: In function "test_module_init":
/home/petros/test-module.c:7:11: warning: initialization makes
 ↪pointer from integer without a cast [-Wint-conversion]
  int *p = 1;
           ^
  Building modules, stage 2.
  MODPOST 1 modules
  LD [M]  /home/petros/test-module.ko
make[1]: Leaving directory '/usr/src/
↪linux-headers-4.9.0-8-amd64'
Note: you may see a compilation warning. Ignore it for now. This warning will be what triggers your kernel crash.
Be careful now. Once you load the .ko file, the system will crash, so make sure everything is saved and synchronized to disk:
$ sync && sudo insmod test-module.ko
Similar to before, the system will crash, the kexec
kernel/environment will help gather everything and save it somewhere in
/var/crash, followed by an automatic reboot. After you have
rebooted and are back into a functional state, locate the new crash
directory and change into it:
$ cd /var/crash/201902261035/
Also, copy the unstripped kernel object file for your test-module from
your home directory and into the current working directory:
$ sudo cp ~/test.o /var/crash/201902261035/
Load the crash file with your debug kernel:
$ sudo crash dump.201902261035 /usr/lib/debug/
↪vmlinux-4.9.0-8-amd64
Your summary should look something like this:
      KERNEL: /usr/lib/debug/vmlinux-4.9.0-8-amd64
    DUMPFILE: dump.201902261035  [PARTIAL DUMP]
        CPUS: 4
        DATE: Tue Feb 26 10:37:47 2019
      UPTIME: 00:11:16
LOAD AVERAGE: 0.24, 0.06, 0.02
       TASKS: 102
    NODENAME: deb-panic
     RELEASE: 4.9.0-8-amd64
     VERSION: #1 SMP Debian 4.9.144-3 (2019-02-02)
     MACHINE: x86_64  (2592 Mhz)
      MEMORY: 4 GB
       PANIC: "BUG: unable to handle kernel NULL pointer
 ↪dereference at 0000000000000001"
         PID: 1493
     COMMAND: "insmod"
        TASK: ffff893c5a5a5080 [THREAD_INFO: ffff893c5a5a5080]
         CPU: 3
       STATE: TASK_RUNNING (PANIC)
The reason for the kernel crash is summarized as follows:
BUG: unable to handle kernel NULL pointer dereference at
0000000000000001
. The userspace command that led to the panic
was your insmod.
A backtrace will reveal a page fault exception at address
ffffffffc05ed005:
crash> bt
PID: 1493   TASK: ffff893c5a5a5080  CPU: 3  COMMAND: "insmod"
 #0 [ffff9dcd013b79f0] machine_kexec at ffffffffa3a53f68
 #1 [ffff9dcd013b7a48] __crash_kexec at ffffffffa3b086d1
 #2 [ffff9dcd013b7b08] crash_kexec at ffffffffa3b08738
 #3 [ffff9dcd013b7b20] oops_end at ffffffffa3a298b3
 #4 [ffff9dcd013b7b40] no_context at ffffffffa3a619b1
 #5 [ffff9dcd013b7ba0] __do_page_fault at ffffffffa3a62476
 #6 [ffff9dcd013b7c10] page_fault at ffffffffa401a618
    [exception RIP: init_module+5]
    RIP: ffffffffc05ed005  RSP: ffff9dcd013b7cc8  RFLAGS: 00010246
    RAX: 0000000000000000  RBX: 0000000000000000  RCX: 0000000000000000
    RDX: 0000000080000000  RSI: ffff893c5a5a5ac0  RDI: ffffffffc05ed000
    RBP: ffffffffc05ed000   R8: 0000000000020098   R9: 0000000000000006
    R10: 0000000000000000  R11: ffff893c5a4d8100  R12: ffff893c5880d460
    R13: ffff893c56500e80  R14: ffffffffc05ef000  R15: ffffffffc05ef050
    ORIG_RAX: ffffffffffffffff  CS: 0010  SS: 0018
 #7 [ffff9dcd013b7cc8] do_one_initcall at ffffffffa3a0218e
 #8 [ffff9dcd013b7d38] do_init_module at ffffffffa3b81531
 #9 [ffff9dcd013b7d58] load_module at ffffffffa3b04aaa
#10 [ffff9dcd013b7e90] SYSC_finit_module at ffffffffa3b051f6
#11 [ffff9dcd013b7f38] do_syscall_64 at ffffffffa3a03b7d
#12 [ffff9dcd013b7f50] entry_SYSCALL_64_after_swapgs at ffffffffa401924e
    RIP: 00007f124662c469  RSP: 00007fffc4ca04a8  RFLAGS: 00000246
    RAX: ffffffffffffffda  RBX: 0000564213d111f0  RCX: 00007f124662c469
    RDX: 0000000000000000  RSI: 00005642129d3638  RDI: 0000000000000003
    RBP: 00005642129d3638   R8: 0000000000000000   R9: 00007f12468e3ea0
    R10: 0000000000000003  R11: 0000000000000246  R12: 0000000000000000
    R13: 0000564213d10130  R14: 0000000000000000  R15: 0000000000000000
    ORIG_RAX: 0000000000000139  CS: 0033  SS: 002b
Let's attempt to look at the symbol at the address
ffffffffc05ed005:
crash> sym ffffffffc05ed005
ffffffffc05ed005 (t) init_module+5 [test-module]
Hmm. The issue occurred somewhere in the module initialization code of
the test-module kernel driver. But what happened to all of
the details shown in the earlier analysis? Well, because this code is
not part of the debug kernel image, you'll need to find a way to load
it into your crash analysis. This is why I instructed you to copy over the
unstripped object file into your current working directory. Now it's time to load
the module's object file:
crash> mod -s test ./test.o
     MODULE       NAME                   SIZE  OBJECT FILE
ffffffffc05ef000  test                  16384  ./test.o
Now you can go back and look at the same symbol address:
crash> sym ffffffffc05ed005
ffffffffc05ed005 (T) init_module+5 [test-module]
 ↪/home/petros/test-module.c: 8
And, now it's time to revisit to your code and look at line 8:
$ sed -n 8p test.c
        printk("%d\n", *p);
There you have it. The page fault occurred when you attempted to print the poorly defined pointer. Remember the compilation warning from earlier? Well, it was warning you for a reason, and in this current case, it's the reason that triggered the kernel panic. You may not be as fortunate in future coding cases.
What Else Can You Do Here?
The kernel crash file will preserve many artifacts from your system at the
event of your crash. You can list a short summary of available commands with the
help command:
crash> help

*            files        mach         repeat       timer
alias        foreach      mod          runq         tree
ascii        fuser        mount        search       union
bt           gdb          net          set          vm
btop         help         p            sig          vtop
dev          ipcs         ps           struct       waitq
dis          irq          pte          swap         whatis
eval         kmem         ptob         sym          wr
exit         list         ptov         sys          q
extend       log          rd           task
For instance, if you want to see a general summary of memory utilization:
crash> kmem -i
                 PAGES        TOTAL      PERCENTAGE
    TOTAL MEM   979869       3.7 GB         ----
         FREE   835519       3.2 GB   85% of TOTAL MEM
         USED   144350     563.9 MB   14% of TOTAL MEM
       SHARED     8374      32.7 MB    0% of TOTAL MEM
      BUFFERS     3849        15 MB    0% of TOTAL MEM
       CACHED        0            0    0% of TOTAL MEM
         SLAB     5911      23.1 MB    0% of TOTAL MEM

   TOTAL SWAP  1047807         4 GB         ----
    SWAP USED        0            0    0% of TOTAL SWAP
    SWAP FREE  1047807         4 GB  100% of TOTAL SWAP

 COMMIT LIMIT  1537741       5.9 GB         ----
    COMMITTED    16370      63.9 MB    1% of TOTAL LIMIT
If you want to see what dmesg logged up to the point of
the failure:
crash> log

[    0.000000] Linux version 4.9.0-8-amd64
 ↪(debian-kernel@lists.debian.org) (gcc version 6.3.0
 ↪20170516 (Debian 6.3.0-18+deb9u1) ) #1 SMP Debian
 ↪4.9.144-3 (2019-02-02)
[    0.000000] Command line: BOOT_IMAGE=/boot/
↪vmlinuz-4.9.0-8-amd64 root=UUID=bd76b0fe-9d09-40a9-
↪a0d8-a7533620f6fa ro quiet crashkernel=128M
[    0.000000] x86/fpu: Supporting XSAVE feature 0x001:
 ↪'x87 floating point registers'
[    0.000000] x86/fpu: Supporting XSAVE feature 0x002:
 ↪'SSE registers'
[    0.000000] x86/fpu: Supporting XSAVE feature 0x004:
 ↪'AVX registers'
[    0.000000] x86/fpu: xstate_offset[2]:  576, xstate_sizes[2]:
 ↪256

[ .... ]
Using the same crash utility, you can drill even deeper into memory
locations and their contents, what is being handled by every CPU core
at the time of the crash and so much more. If you want to learn more
about these functions, simply type help followed by the
function name:
crash> help mount
Something similar to a man page will load onto your screen.
SummarySo, there you have it: an introduction into kernel crash debugging. This article barely scrapes the surface, but hopefully, it will provide you with a proper starting point to help diagnose kernel crashes in production, development and test environments.

Petros Koutoupis, LJ Editor at Large, is currently a senior performance software engineer at Cray for its Lustre High Performance File System division. He is also the creator and maintainer of the RapidDisk Project. Petros has worked in the data storage industry for well over a decade and has helped pioneer the many technologies unleashed in the wild today.
Recent Articles


