
Debugging Embedded Linux Applications
Many reasons exist why Linux is a good operating system for embedded applications. Besides being open source and cost effective, one of the most important reasons is portability; a Linux application can be developed for one architecture and easily ported to another. For instance, an application written for a desktop Linux system can also run on an embedded Linux system in most circumstances. This means that a desktop system can be used for development of an application that ultimately must run in an embedded environment, where development might be more difficult.
The Linux that runs on an embedded system has the same set of APIs as the Linux running on a powerful desktop system, even though the two systems may use radically different processor architectures. As a result, you can spend at least some of the development cycle on a fully featured Linux desktop machine. In fact, you can do virtually all of your development on such a desktop system, as long as the application does not need direct access to hardware available only on the embedded system, or if that access can be abstracted away for the purpose of development.
Developing on a desktop machine is highly desirable because it is likely to be faster, have more memory (both hard disk and RAM) and offer a more robust user interface for development. In contrast, an embedded system may have limited resources and interfaces. Worse yet, the embedded hardware itself may not be available for use until later in the development cycle.
Eventually, though, the application has to be run on the embedded system. Fortunately, debugging embedded Linux applications is a bit like debugging standard Linux applications. A number of restrictions, however, can make life a little more interesting. I'm going to talk about three areas of embedded development and how each is handled when Linux is the operating system of choice: board setup, multiprocess debugging and runtime error checking. Keeping track of what is what when doing embedded development can be tricky at times, so I've defined some of the terms that I'll be using:
Cross compiler: a compiler that is run on one system and produces executables for another system (for example, compiler runs on x86 and produces PPC code).
Debug agent: a relatively small piece of code that runs on the target and handles low-level debugging details. A much more complex debugger on the host talks to the debug agent through a serial or Ethernet link. GNU's debug agent is called gdbserver.
Host: the system that generally runs the cross compiler and debugger. The GNU tools can be run on the target system, in which case the host and target are the same.
Target: the hardware and OS that the application runs on.
I also refer to a toolchain that I've been working on at Green Hills Software, Inc., scheduled for release in the near future. This toolchain integrates a C/C++ cross compiler and debugger that targets Linux x86 or PPC. Where possible I also mention the GNU debugger (gdb) equivalent for the techniques that I describe. For reference, the embedded Linux system that I put together runs MontaVista's Hard Hat Linux version 1.2, on a Motorola MBX 860 PowerPC board. My host is a Red Hat Linux 6.2 system, though I've also used Red Hat 7.1 and Solaris 7.
My first suggestion is that you take advantage of the ability of Linux to NFS-mount its root partition. If you do this and set up your build environment correctly, you can eliminate the need to download your cross-compiled application code onto the target board. Depending on your target configuration, this may help you avoid having to reburn your entire system kernel and application to Flash every time you make a change to your application code.
Let me give you an example. My host system exports /export/ppc/8xx/target, which is the NFS root directory of the Hard Hat installation. I then put my source code and Makefiles into /export/ppc/8xx/target/home/ndf. When I cross compile application code, the executables get deposited into this directory, and it magically appears in the filesystem of my target board (see Figure 1). If you have problems getting the NFS mount set up, I suggest you look at the various HOWTOs available on the Net. I found http://www.Linuxdoc.org/HOWTO/Network-boot-HOWTO/ to be complete. It also gives detailed information on booting multiple clients from a single host export.

Figure 1. Application Code on Target Board's Filesystem
Beyond completely getting rid of the hassle of downloading application code to the board, having the entire target filesystem available on the host makes several debugging tasks quite painless. In particular it means that a debugger running on the host can get debugging symbols from the libraries on the target system. Ever put a breakpoint on some common libc function, say ``write''? Well, depending on your debugging setup, that may not be possible when doing embedded Linux debugging.
The Green Hills debug agent sends information on the shared objects loaded into the target process back to the host processor. Because those objects actually are stored on the host when using the NFS setup, the debugger can access their symbols and set breakpoints on them. In this case, when using the Green Hills debugger, embedded debugging and standard native debugging are the same.
The gdb debugger can access these symbols if it is run natively on the target. But gdb has a footprint of 3.5MB, too large for many embedded systems. Further, the GNU debug server cannot tell the gdb running on your host which shared objects have been loaded into your program at runtime. As a result, there is no way for gdb to set breakpoints in shared object code when gdb is running on the host.
While we're talking about gdb's size, it is also important to note that the GNU compiler puts all debugging information into the final executables, which can make them very large. The Green Hills compiler puts debugging information into separate files that do not have to be resident on the target system, giving you more executable for your memory on the target. This isn't so important while doing the sort of NFS development I describe here, but it does become important when the final standalone system is being debugged and every byte of Flash memory on the target becomes important. To help reduce image size you will probably want to remove the debug information from the executable with the strip utility. This will make source-code debugging impossible, although assembly-level debugging is still possible.
One nice debugging capability that NFS-mounting lets you do is determine the cause of a program's exit. Most embedded applications involve some form of infinite loop, so if the program exits, something has gone very wrong. It can be difficult to determine why a process has exited because by the time you know what has happened it is too late; the process has already terminated. By putting breakpoints on likely exit points, say ``exit'', ``_exit'' and ``abort'', then bringing up a call stack on the process when it hits one of them, you can see what was going on when the process decided to terminate.
A debugging issue that often comes up in more complex applications is interactions among multiple processes. To complicate matters, these processes may be running on different systems that also may be running different architectures and operating systems. Multiple process debugging is a large topic, well beyond the scope of this article, although I always rather liked the O'Reilly pthreads books' approach, paraphrased as: just don't write buggy code. That said, there is one small aspect of multiple process debugging that I would like to spend some time on: fork debugging.
Many applications need to spawn off child processes to take care of certain tasks. Unfortunately, as of the time of writing, the Linux kernel does not provide a way to debug a child process after a fork. There are a couple of approaches to solving this problem. One is to modify your code so that after a fork the child process goes into an infinite loop. The code might look something like this:
     if( (pid = fork()) == 0) {
          /* child */
#ifdef DEBUG_FORKS
       int waiting=1;
       while(waiting) {}
#endif
         DoChildThing();
     } else {
          /* parent */
          DoParentThing();
     }
By inspecting the return value of ``fork'' in the parent (or looking for a new process entry using the ps command on the target), you can attach to the child process and set the ``waiting'' variable to 0 to break the child out of the loop. Unfortunately, gdbserver does not support attaching to processes, but running gdb on the target (if it fits) is still an option.
The Green Hills debugger is able to simulate this at runtime with no compile-time changes, and it will bring up a debugger automatically on the parent and child right after they have returned from the call to fork. A nice benefit of this approach is you do not need source code for the application in order to debug it. In fact, to test this feature out, I debugged the inetd super server and caught the forks that result from inetd spawning child processes to service incoming network requests.
This ability to debug multiple processes simultaneously, even across different architectures and operating systems, means we can do some complex debugging operations. For instance, we can bind commands to a breakpoint, and those commands will execute when that breakpoint is hit. Using this feature you can set a breakpoint in a process running on a Linux x86 system that, when hit, would set another breakpoint on a Linux PowerPC system running elsewhere on the network. Essentially, this lets you script possible race conditions that would not be likely to occur otherwise in normal testing.
Memory leak detection and runtime error checking are related debugging issues. Memory leaks, in particular, are difficult problems to detect, and they can cause bugs that don't show up until a system has been running weeks or even longer. Fortunately, both detection and notification can be automated. The Green Hills toolchain, for instance, can have the compiler make tweaks to the code it generates so its debugger can determine if any areas of memory are no longer referenced by a process.
The memory leak tool provides the address of the memory leak, its size in bytes and a four-level call stack from the point where the memory was allocated (see Figure 2). You can also make a call to a special function in the application that will print out this same memory leak information to standard error. Some users have shipped live systems that send back reports about their status, including the output from this memory leak trace. To give an idea of this feature's power, an example is in order. Below is an easy-to-spot memory leak:
int *data_ptr = (int*)malloc(sizeof(int) * 100);
data_ptr = NULL; /* Oops! */
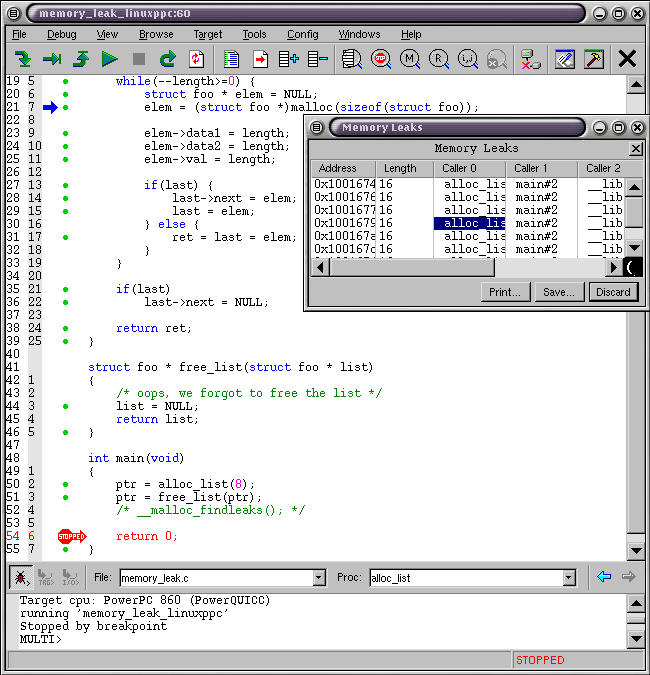
Figure 2. Pinpointing Memory Leaks
If we halt the process right after the call to malloc, the tool won't detect a memory leak. However, after stepping over the line setting the pointer to NULL, the memory leak tool can determine that a leak occurred and will indicate that the leak originated from the previous line.
Once the leak is found it is usually a simple step to add a call to free or delete in the appropriate location. Unfortunately, the appropriate location can often be difficult to find. Even when the call is added, it is important that it be called once and only once. Memory access violations, such as freeing a pointer twice or accessing invalid memory, can be very hard to track down because the side effects are often unpredictable, and they do not always show up where the original error occurred.
From personal experience I believe that Linux has a much tighter memory management system than many other OSes (such as Solaris), so memory access problems tend to show up sooner. Still, it can take a long time to track these problems down. Some runtime error-detection software is available in the public domain (see Resources), and some is open source. The Green Hills compiler can deal with these problems by instrumenting the application code to check for memory access violations and other errors at runtime. When the debugger is attached to a process that encounters one of these runtime errors, it halts the process prior to executing the offending operation and prints out a message indicating what sort of runtime error has occurred.
Automating memory leak detection and other forms of runtime error checking make debugging a whole lot easier. Bugs that can take weeks to track down, or worse, bugs in someone else's code that show up in your own code, can be found in a few moments. Sometimes it almost feels like cheating.

Nathan Field is a software engineer at Green Hills Software, Inc. He earned his BS in Computer Science from Harvey Mudd College in 2000. He enjoys martial arts, motorcycling and living in Santa Barbara. You can reach him at nathan_field@ghs.com.
email: nathan_field@ghs.com

