
Introduction to Forensics
There are certain aspects to system administration that you can learn only from experience. Computer forensics (among other things the ability to piece together clues from a system to determine how an intruder broke in) can take years or even decades to master. If you have never conducted a forensics analysis on a computer, you might not even know exactly where to start. In this guide, I cover how to use the set of forensics tools in Sleuthkit with its Web front end, Autopsy, to organize your first forensics case.
One of the most common scenarios in which you might want to use forensics tools on a system is the case of a break-in. If your system has been compromised, you must figure out how the attacker broke in so you can patch that security hole. Before you do anything, you need to make an important decision—do you plan to involve law enforcement and prosecute the attacker? If the answer is yes, you should leave the compromised system alone and make no changes to it. Any changes you make post-attack could complicate and taint the evidence, and because of that, many people have a policy of unplugging a system once they detect an attack and leaving it off until law enforcement arrives. Investigators likely will want the complete system, or at least the drives, so they can store it safely; thus, your forensics analysis might end here until your system is returned.
If you do not plan to prosecute the attacker, you still need to set up some policies beforehand on how to respond to an attack. The first policy you should create concerns whether to pull the power from a compromised server immediately. Two main schools of thought exist on this. One school of thought says that because a live server contains valuable data in RAM, such as running processes, logged in users and so forth, that you should try to collect all of that live data first and then power off the server. The opposing school says that once a system is compromised, all parts of the system are potentially compromised and cannot be trusted, including any tools you might use to grab live system data, so you should pull the power from the server immediately. Otherwise, attackers also could have compromised shutdown scripts to remove their tracks. I personally lean more toward the second school of thought and believe that no commands should be run and no changes made to a system once a break-in is discovered.
The second policy you should create beforehand concerns how and whether to image the hard drives on the system and how and when to bring the system back into service. If you cannot tolerate much downtime on the system, you probably will want to create an exact image of the drives to examine elsewhere, and then re-install your operating system on the original drives. Remember, once a system has been compromised, you can no longer trust the system. There could very well be a back door that you missed. It's worth saying again that if you plan to prosecute, you will not be able to bring the system back into service, at least not with the original drives as investigators will need them. If you have the extra space, I recommend creating images of your drives to work from and leaving the originals alone. If you accidentally write to the images, you always can create a fresh image from the original drives. Autopsy can manage raw disk or partition images, so any imaging tool, from dd to Ghost, will work.
For the purposes of this guide, I assume you have created an image of any drives on the system and have stored them on a separate machine that you will use for the forensics analysis. This new machine needs to have both Sleuthkit and Autopsy installed. Some distributions have both Sleuthkit and Autopsy available as precompiled packages, so you can use your distribution's package manager to install them. Otherwise, you can download and compile the tools from the tarballs available on the main project site, sleuthkit.org.
Autopsy works as a Web-based front end to all of the Sleuthkit tools and makes it easy to examine a filesystem without learning each of the different command-line tools. Autopsy also makes it easy to organize multiple forensics analyses into different cases, so you can reference them later. Once Autopsy is installed, get root privileges, and type autopsy into a terminal to start the program. Instructions on Autopsy's settings appear in the terminal, including the default location for evidence (/var/lib/autopsy) and the default port on which it listens (9999). Open a Web browser and type in http://localhost:9999/autopsy to view the default Autopsy page and start your investigation.
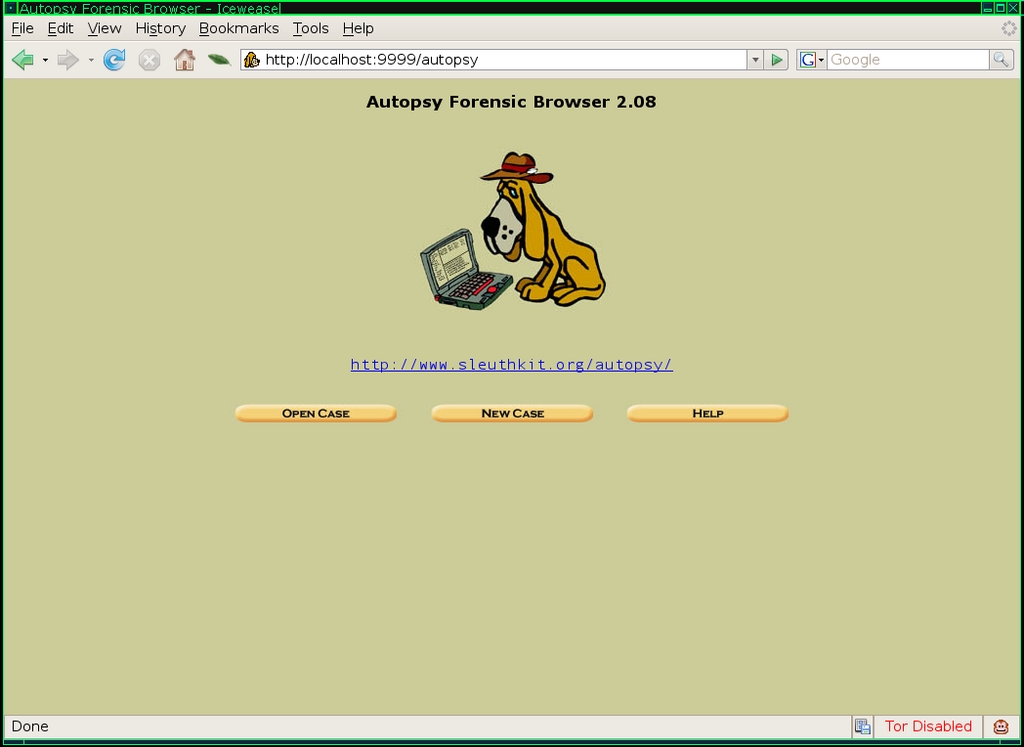
Figure 1. Default Autopsy Page
From the main Autopsy page, click Open Case to open a case you already have created, or for this example, click New Case. In the New Case page, you can name and describe your case, and you also can provide a list of investigators who will work on the case. Once your case is named and created, you will see the case gallery—a page that simply lists all the cases you have created. If this is your first case, simply click OK to proceed to the Host Gallery. The Host Gallery lists all the servers you are investigating for this case. In our example, only one host was compromised, but often an attacker will move from one compromised host to another, so include as many hosts as you need to investigate in this gallery. As with the Case Gallery, click Add Host to fill out information about the host you are adding.
You will see some interesting fields on the Add Host page relating to time. If the host was set to a time zone different from your local time zone, be sure to put its time zone in the Time Zone field. When you piece together a chain of events, especially across multiple hosts, having correctly synced time is valuable. The Timeskew Adjustment field lets you account for a server with out-of-sync time, and Autopsy automatically adjusts the times to reflect any skew you put in this field.
When you add the host and go back to the Host Gallery, select the host to analyze and click OK to go to the Host Manager page. If this is a new host, the first thing you should do is click Add Image File to add the image you created previously. The image page has only three fields: Location, Type and Import Method. Autopsy expects that the image is available somewhere on the local computer—either actually on the local disk or via an NFS or SMB mount. Type the full file path to the image file in the Location field. The Type field lets you inform Autopsy of the type of image you created. If you imaged the entire drive, select Disk; otherwise, select Partition. If you select Disk, Autopsy scans the partition table for you and lists all the image's partitions.
Autopsy needs the image file to be in its evidence locker in some form, and the Import Method field lets you choose how to put the image file there. If you store all your Autopsy evidence on a separate USB drive, you may want to select Copy, so that a copy of the image stays with the rest of the evidence. If your evidence locker is on your local disk along with the image (which is likely under the default settings), select Symlink or Move, depending on whether you want the image to stay in its original location. Repeat these steps to add any additional images for your host.
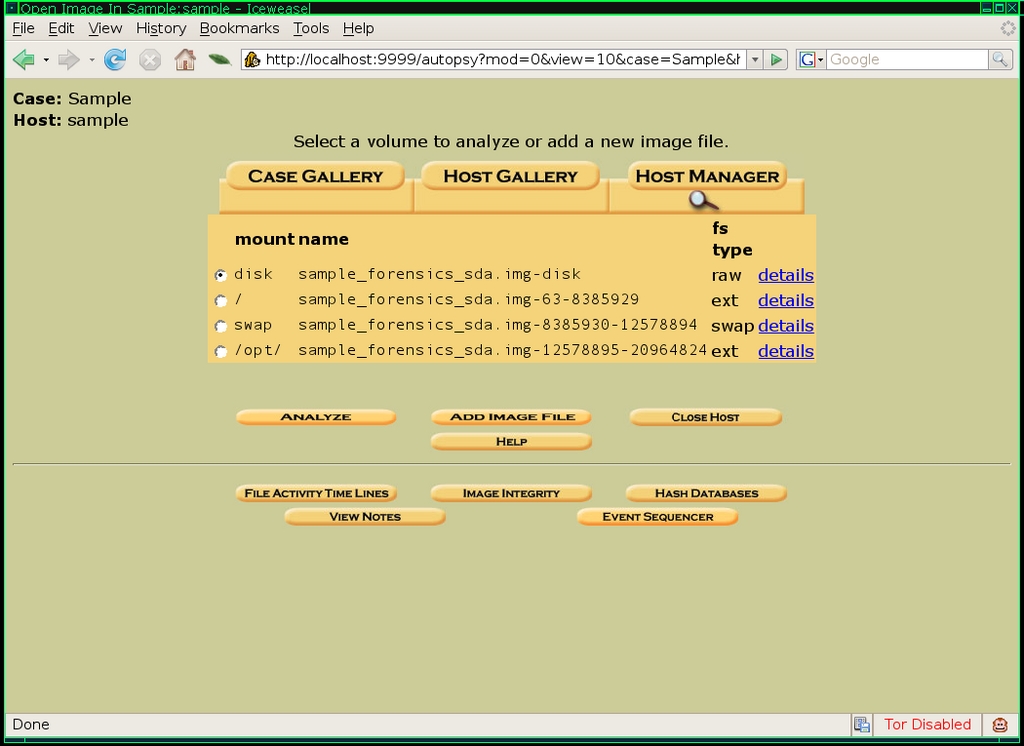
Figure 2. Host Manager Page
Now that you have created the case, added a host and selected any disk images, you are ready to start the analysis. On the Host Manager page, you will see all the partitions available to analyze. The root (/) partition is a good place to start, so select it, and click Analyze. The Analyze page lists a number of different ways to investigate the filesystem, but click the File Analysis button along the top of the screen to enter one of the main pages you will use for this analysis.
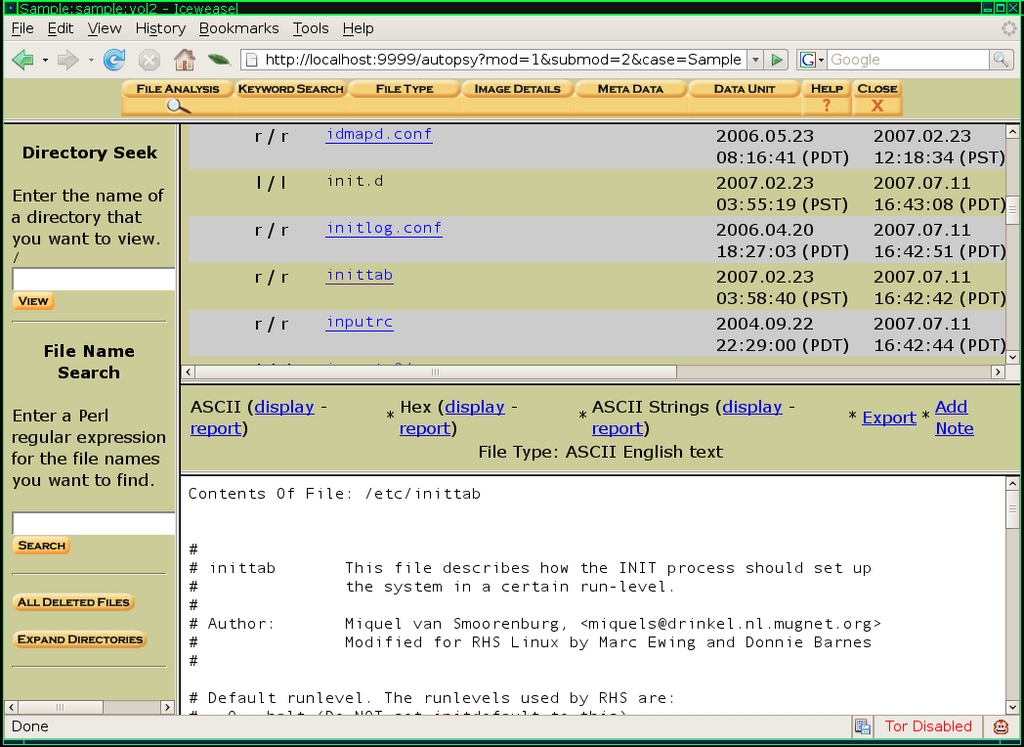
Figure 3. File Analysis
The File Analysis page gives you a complete view of the filesystem, starting at its root. The top-right frame lists all the files in the current directory, along with additional information each in its own field, including MAC times, permissions and file size. MAC (Modified, Accessed and Changed times), refers to three different changes the filesystem keeps track of for each file. The modified time is the last time the file or directory actually was written to. For instance, if you open a text file, edit it and save the changes, this updates the modified time. The access time is the last time the file or directory was accessed at all. Reading a file updates its access time, and listing the contents of a directory also updates its access time. The changed time keeps track of the last time the file's metadata (such as file permissions and owner) were changed. It's possible, in some cases, for some or all of these times to match.
Each of the files or directories in the File Analysis page are hyperlinked. If you click a directory, the page changes to list the contents of that directory. If you click a file, the bottom-right frame changes to list the contents of the file (even if it's binary) along with a number of functions you can perform on that file. You can display the ASCII or Hex versions of a file or have Autopsy scan the file and display only the ASCII strings inside. This feature is particularly handy to try on suspected trojan files. Often the ASCII strings inside a trojan binary list strange IRC channels or other remote servers or passwords the attacker is using. You also can export a copy of the file to your local disk for further examination.
Attackers often like to delete files to cover their tracks, but Autopsy can attempt to recover them from the free space on the filesystem. Go to the File Analysis page, click the All Deleted Files button on the bottom of the left-hand frame, and Autopsy lists all the deleted files it finds on the system. If Autopsy can recover that much information, you also can see the MAC times and may even be able to click on the file and recover its original contents!
All of these features are handy, but one of the most useful is the Add Note feature. If, for instance, you notice a system binary in your /bin directory that has a strange recent modified date and you notice some suspicious ASCII strings inside, you could click Add Note and list your findings. On the Add Note page, you also can add a sequencer event based on MAC time. If you thought the modified time was suspicious, you might select M-Time on the Add Note page. When you add notes like this for a number of files or directories, you end up with a large series of notes on what you have found along with interesting times. From the Host Manager window (the window that lists the host's partitions), click View Notes to see the list. This is an invaluable feature when you are trying to piece together the sequence of events from an attacker—particularly when you want to share your findings with others.
If you find a piece of information, such as an IP address or a particular server name as you scan files, you also can click Keyword Search at the top of the Analysis page to scan the entire filesystem for that keyword. You might find log entries or additional files the attacker uploaded that reference that keyword in unlikely places with this tool.
One thing you will discover is that the sequence of events is very important when figuring out an attacker's steps. The File Analysis window lets you sort by any of the headers, including the MAC times. An attacker often will replace a system binary under /bin or /sbin with a trojan, and because that will update the modified time for a file, if you sort the /bin and /sbin directories by modified time in the File Analysis window, you quickly can see suspicious file changes, such as a series of core programs, like ls, vi and echo, all modified a few days ago at a time when you know you didn't update any programs.
If you are new to forensics, you might not be sure of exactly where to start looking in your filesystem. A few directories often contain evidence of an attack that will at least give you a starting point. I've already mentioned the /bin and /sbin directories, as attackers often replace core system binaries in these directories with trojans. The /tmp and /var/tmp directories also are favorite locations, as any user on the system can write to them, so attackers often start their attacks in these directories and download rootkits and other tools here. Pay particular attention for hidden directories (directories that start with a .) in /var/tmp, as that's one way for attackers to cover their tracks from a casual observer. Finally, scan under /home and /root for suspicious files or strange commands in each users' .bash_history file.
What you hope to find is some idea of when attackers were active on your system. Once you have an idea of when the attackers were there, you can check file access and modify times during that period to track down where the attackers were on your system and which files they touched. Although you certainly could browse through the File Analysis window directory by directory, Autopsy provides an easier way via its File Activity Time Line. If you are currently in the File Analysis window, click Close to return to the main Host Manager window that lists the images you have added for your host. From there, click the File Activity Time Line button. Next, click Create Data File, click the check box next to all of the images it lists, and then click OK. This job will take some time, depending on the size and speed of your disk and your CPU.
Once the data file is created, click OK to proceed to the Create Timeline window. In this window, you can narrow down your timeline so that it lists only a particular time period; however, just leave all the options as they are for now and click OK. As you never exactly know where an investigation will lead, you don't want to rule out periods of time that might have valuable clues. When the timeline has been created, click OK to view the Web-based timeline viewer, but a note on that page gives a valuable tip—the timeline is easier to view via a text editor than from the Web interface. Find the raw timeline text file under /var/lib/autopsy/case/host/output/timeline.txt. If you named your case Investigation1 and your host Gonzo, you can find the file under /var/lib/autopsy/Investigation1/Gonzo/output/timeline.txt.
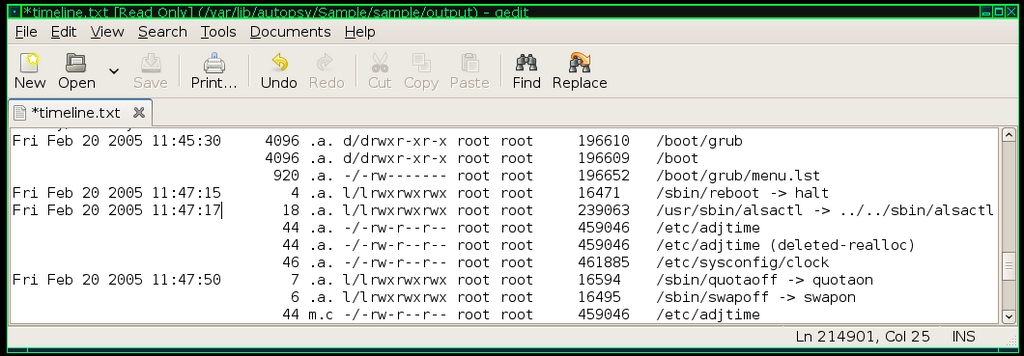
Figure 4. Sample timeline.txt File
The timeline.txt file lists every file on your image sorted by MAC time. This file contains a lot of information, but once you figure out what each field stands for, it's easier to decipher. The first column lists the time in question for a file followed by the file size. The next field denotes whether this time was a time the file was modified, accessed, changed or any combination of the three. If a file was both modified and accessed at this time, but its metadata was not changed, you would see “ma.” in this field. The next field lists the file permissions, followed by the user and group that owned the file. The final two fields list the filesystem inode and the full path to the file or directory. Note that if a group of files has the same time, only the first time field is filled.
If you have found one of the attackers' files, try to locate it in the timeline and see what other files were accessed and especially modified during that time period. With this method, you often can see a list of accessed files that show someone compiling or executing a program. If you notice that the attackers used a particular account on the system, use the File Analysis window to check the /home/username/.bash_history for that user and see any other commands the attackers might have run.
In addition, look at the login history, which often is found under /var/log/messages, for other times that user has logged in and try to correlate those times with any other file activity on the system inside the timeline.txt file. Remember to add notes for each clue you find—as you dig further and further into the filesystem, it can be difficult to keep track of all the different files and how they correlate, but the notes page makes it easy to see. The ultimate goal is to try to locate the earliest time attackers left tracks on the system and use that information to figure out how they got in.
As you might gather, thorough forensics analysis can be a time-consuming process. Even with a tool like Autopsy, it still takes time and experience to make sense of all of the data it presents so you can piece together an attack. One easy way to gain experience is to image your personal system and view it through Autopsy. Create a timeline and see whether you can track down some of the commands you last ran or files you last edited. You might possibly even want to attack your own machine and see if you can use Autopsy to retrace your steps. Although nothing can replace real data, this sort of practice goes a long way toward understanding forensics so you're prepared when a real attack occurs.
Kyle Rankin is a Senior Systems Administrator in the San Francisco Bay Area and the author of a number of books, including Knoppix Hacks and Ubuntu Hacks for O'Reilly Media. He is currently the president of the North Bay Linux Users' Group.
