
Your Network's Secret Life, Part 2
Many people really do have everything sitting in one network, so it does pay to watch that network. Unfortunately, there is an awful lot happening, and it can be darn difficult to imagine what it all looks like.
One of the things I tried to do in the last column was show that we shouldn't forget the basic tools that come with our systems. Many of those great flashy programs use these tools somewhere beneath their shiny surfaces--why shouldn't we do the same? We'll get flashy soon enough; right now though, I would like to look at a couple of other, less glamorous, network monitoring tools, and show you some of the power they possess. Then we'll do some flash, I promise.
Okay, you all know about the ping command. The official purpose of ping is to send ICMP ECHO_REQUEST packets to remote hosts. The name comes from radar pings sent by submarines to detect other subs or ships underwater. In its most basic form, ping lets us know whether a remote host can be reached. If I wanted to see whether www.linuxjournal.com was up (other than doing it the smart way and using a browser), I might use the following command:
$ ping -c 4 www.linuxjournal.com
The -c flag tells ping to send only four packets. The reply looks something like this:
PING www.linuxjournal.com (64.39.18.136) from 192.168.22.100 : 56(84) bytes of data.
     64 bytes from 64.39.18.136: icmp_seq=0 ttl=241 time=76.4 ms
     64 bytes from 64.39.18.136: icmp_seq=1 ttl=241 time=73.0 ms
     64 bytes from 64.39.18.136: icmp_seq=2 ttl=241 time=74.8 ms
     64 bytes from 64.39.18.136: icmp_seq=3 ttl=241 time=74.8 ms
     --- www.linuxjournal.com ping statistics ---
     4 packets transmitted, 4 packets received, 0% packet loss
     round-trip min/avg/max = 73.0/74.7/76.4 ms
We get a nice little display telling us about packet turnaround time, as well as an average of that time over the course of the four pings. Well, if I do that with a host on my local network (a notebook running Windows 95 in this case), I get a response similar to the one above (with much shorter turnaround times, of course). That PC is at address 192.168.22.3.
64 bytes from speedy (192.168.22.3): icmp_seq=0 ttl=32 time=782 usec
Okay, so what does that tell me other than that the PC is up (good) and the response time is pretty amazing (also good, but it is a local network)? Well, for one thing it has updated my Linux server's ARP table. ARP stands for address resolution protocol. What ARP does is map your computer's IP address to the Ethernet address every physical network device has. It is not uncommon for people to use the term "IP address" to mean the same thing as "Ethernet address". Unfortunately, that's not entirely correct. For instance, while it is very easy to change your IP address, changing your Ethernet address requires that you get a new Ethernet card. That address, by the way, is more often referred to as the MAC address (media access control). The MAC or Ethernet address belongs to the physical card and is unique in all the world (or it should be). An IP address is assigned to an Ethernet address. So far so good?
So what does this have to do with the ping command of earlier?
As I mentioned, your ARP table was updated as a result of that ping. Since the table is dynamic, entries disappear from the table cache, and the ping refreshes that entry in the table. For the most part, people don't really look at Ethernet addresses or think in terms of them. Let's look at the ARP table and see what kind of information we can discover from that.
$ /sbin/arp -a
The above command will display the contents of the ARP cache. When I first issued the command, I only saw the system called testsys. After my ping, the notebook ("speedy") appeared in the cache as shown below.
   speedy (192.168.22.3) at 00:C0:4F:EE:4A:9D [ether] on eth0
   testsys (192.168.22.10) at 00:00:E8:8B:45:E6 [ether] on eth0
The Ethernet or MAC address for speedy is "00:C0:4F:EE:4A:9D". An interesting note on those numbers in the MAC address. The information on what those numbers actually mean can be found in RFC1700 (Assigned Numbers). There is an awful lot of information here, so scroll down the page until you get to the section titled "ETHERNET VENDOR ADDRESS COMPONENTS". You'll see a table that looks like this:
     00000C  Cisco
     00000E  Fujitsu
     00000F  NeXT
     000010  Sytek
     00001D  Cabletron
     000020  DIAB (Data Intdustrier AB)
     000022  Visual Technology
     00002A  TRW
As you can probably imagine, the number of companies and manufacturers making these cards has increased. Consequently, you might want to check out the standards document for a more up to date picture of where things stand, http://standards.ieee.org/regauth/oui/oui.txt.
Let's take a look at those cards. Using the first six digits in the Ethernet address, let's scroll down that list until we get to "0000E8". We find that the generic Ethernet card in my machine at address 192.168.22.10 (using a rtl8139 driver) was conceivably made by a company called ACCTON TECHNOLOGY CORP. Until now, I hadn't known that they even existed. Let's check out the next card on speedy. Its Ethernet address prefix is "00C04F". On my list, that shows up as DELL COMPUTER CORPORATION. As it turns out, the notebook is a Dell Latitude.
The reason I mentioned all this is there is more to your network traffic than just IP. Communication occurs on many different layers (I won't talk about the OSI reference model today). All this stuff about packets flying back and forth is nice enough, but it is somewhat hard to visualize. So we've got a connection open to www.magauniversal.dom, but just what is happening over that connection? What kind of impact are we talking about? Just how many machines is our server communing with while we try to get this whole thing pictured in our brains?
This is where EtherApe (written by Juan Toledo and others) comes into play. EtherApe is a graphical network monitor that lets you see the action taking place over your network connection. EtherApe displays live connections in a manner that lets you visualize which connections are busier than others. The nodes appear bigger as larger amounts of traffic go across your network. It supports various adapter types including PPP, fiber, Ethernet and others. There are three display modes; you can specify IP, TCP and that other level, Ethernet (link layer). I personally enjoy the Ethernet display because I can see non-IP protocols displayed as well, providing for a much richer landscape.
At the time I wrote this, the latest version of EtherApe was 0.7.6. You can pick up the latest copy at http://etherape.sourceforge.net/.
If you want to save yourself some time and effort, the site does have precompiled binaries in RPM and Debian formats. For reasons I can't personally explain (and no, I did not ask), the Debian package is considered unstable. Of course, you could download the source and build it yourself. For those of you who decide to go that route, you will also need to have several prerequisite libraries installed, including gnome-libs, libglade and Gtk. In addition, you will need to have the libpcap packet capture library installed.
In playing with this one, I used the RPM install. To start the program, simply type etherape &. You should get a window that looks something like the one below. What you see there is a graphical snapshot of what I was doing on my network. I was doing some X11 stuff, working on this article, doing a little web surfing and listening to a radio station via RealAudio. A little quiet on the traffic front, but it does give you an idea of the possibilities.
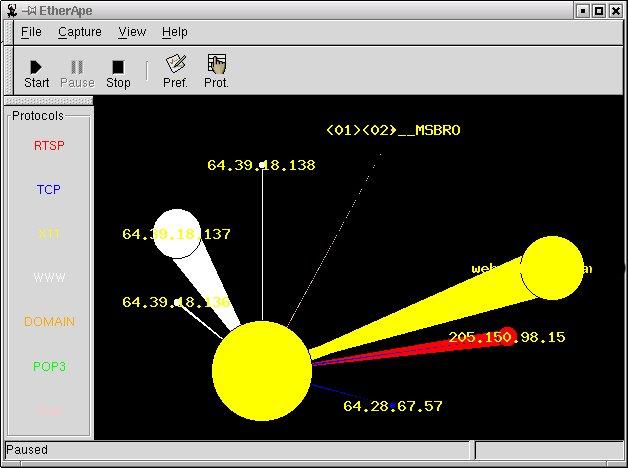
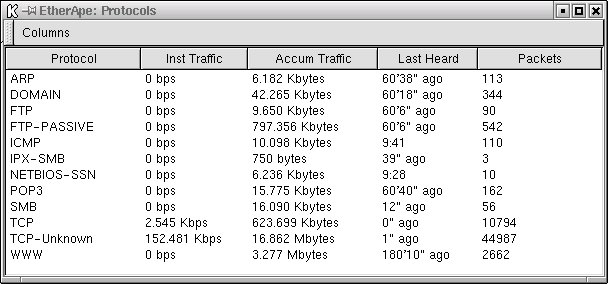
Since there were only a few connections active at the time, it's hard to tell from the image exactly how many protocols and services EtherApe can display. I won't list everything here, but expect to see all the obvious services like DNS, IP, IRC, NETBIOS, SNMP, HTTP and then some. Speaking of protocols, if you click on that little button at the top (the one that says "Prot"), you can display a numerical representation of the traffic in a table like the one below. You can also click "View" and then "Show protocols".
If you find yourself using a particular mode, you probably won't want to reset your view modes each and every time you start the program. Typing the command at your shell prompt with a --help will give you all the command-line arguments. For instance, if you always want to start in Ethernet view mode, the command is as follows:
etherape --mode=ethernet &
As you probably guessed from the version number, this is beta code, but it is still worth a look. The potential for this little application is certainly evident. It's also a great way to have another look at your system and what is happening around you.
But wait! There's more. Unfortunately we'll have to wait until next we meet here on the sunniest corner of the net, the SysAdmin's Corner <insert appropriate smiley here>. Until then, remember to ask yourself . . . if you are not watching your network, who is?
Looking for past articles to this series? Click here for a list.
email: ljeditors@ssc.com

