
Valgrind 2.2.0: Memory Debugging and Profiling
Memory and performance problems plague most of us, but tools are available that can help. One of the best, most powerful and easiest to use is Valgrind. One thing stands out when you use Valgrind--you do not need to recompile, relink or modify your source code. Valgrind is an open-source project available under the GPL 2 license.
Valgrind works on all x86 systems and is being adapted to run on the PowerPC architecture. It works with all major Linux distributions. Valgrind's benefits include:
Dynamic binary translation so you don't need to modify, recompile or relink your applications.
Able to debug and profile large and complex programs.
Usable on almost any kind of software written in any language.
Works with the entire program, including libraries.
Usable with other tools, such as GDB.
Works as a platform for writing and testing new debugging tools.
Also, Valgrind is maintained actively.
The Valgrind distribution includes five major tools that are tightly integrated into the Valgrind core: Memcheck, Addrcheck, Cachegrind, Massif and Helgrind. Memcheck detects the following problems:
Use of uninitialized memory.
Reading/writing memory after it has been freed or deleted.
Reading/writing off the end of malloced or new blocks.
Reading/writing inappropriate areas on the stack.
Memory leaks--where pointers to memory blocks are lost forever.
Passing uninitialized and/or unaddressable memory to system calls.
Mismatched use of malloc/new/new[] vs free/delete/delete[].
Overlapping src and dst pointers in memcpy() and related functions.
Some misuses of the POSIX pthreads API.
When Memcheck is run:
All memory reads and writes are checked.
All calls to malloc/new/free/delete are instrumented.
Immediate error reporting happens, giving source line number, if possible.
Function stack tracing shows how the error line was reached.
Tracks are addressable at the byte-level and initialization of values at the bit-level. So Valgrind detects the use of single uninitialized bits and does not report spurious errors on bitfield operations.
It runs programs about 10--30x slower than normal.
Addrcheck is a lightweight version of Memcheck. It does not check for uninitialized data. The tradeoff is that Addrcheck detects fewer errors than Memcheck but runs about twice as fast (about 5--20x slower than normal). Also, a lot less memory is used. This means programs can be run for longer and cover more test scenarios. And Valgrind still finds a lot of important bugs in this mode. The authors suggest that you use Addrcheck most of the time for finding memory bugs, and occasionally use Memcheck for more thorough checking.
Cachegrind is a cache profiler. It simulates the I1, D1 and L2 caches in your CPU and pinpoints the sources of cache misses in your code. It identifies the number of cache misses, memory references and instructions executed for each line of source code, with per-function, per-module and whole-program summaries. It is useful with programs written in any language. Cachegrind runs programs about 20--100x slower than normal.
Massif is a heap profiler. It performs detailed heap profiling by taking regular snapshots of a program's heap. It produces a graph showing heap usage over time, including information about which parts of the program are responsible for the most memory allocations. The graph is supplemented by a text or HTML file that includes more information for determining where the most memory is being allocated. Massif runs programs about 20x slower than normal. Massif was introduced in version 2.1.1 of Valgrind.
Helgrind is a thread debugger that finds data races in multithreaded programs. It looks for memory locations accessed by more than one (POSIX p-)thread but for which no consistently used (pthread_mutex_)lock can be found. Such locations are indicative of missing synchronization between threads and could cause hard-to-find timing-dependent problems. It is useful for any program that uses pthreads. It is experimental, so the authors really welcome your feedback here.
To make Valgrind even easier to use or to extend its functionality, a number of other tools are available, including Kcachegrind, an extension to Cachegrind that provides more data about call graphs. Its visualization tool also gives a much better overview of the data it collects. There also are patches for vgprof, a Valgrind tool, that profiles in the same manner as gprof but doesn't require recompilation. It works with threaded programs and can profile shared libraries. Several experimental tools also are available, including a memory access tracer, a pointer misuse-checker and a signal-handler checker. Another patch for Valgrind adds watch points on memory locations.
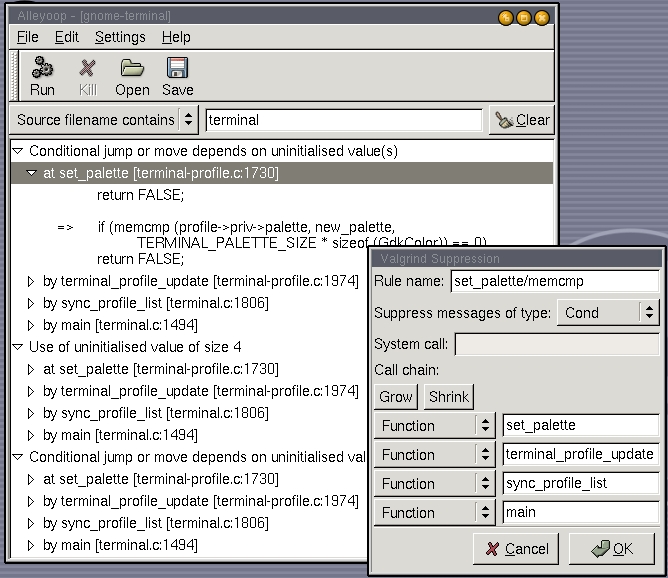
Several graphical front ends have been built for Valgrind. These are the ones we know about: Alleyoop, which is built with Gtk+ and GNOME libraries; Valgui; and Gnogrind. Also, KDevelop v3.0.0 allows you to use Valgrind as a plugin.
Using Valgrind is simple: prefix your normal command line with the Valgrind command and parameters. For example, to run myProg with myArg1 and myArg2 under Valgrind, I would enter:
$ valgrind -tool=valgrind-tool -valgrind-options myProg myArg1, myArg2
where valgrind-tool is one of the tools discussed above. No recompile, relink or source code change is needed. However, if you are checking for memory problems, you receive more specific information if you have compiled your program with debugging turned on (the -g option), disabled inlining and disabled most optimization.
In the case where your program or the libraries it is using have problems, Valgrind can suppress messages caused by known errors. Suppression of error messages is tool-specific.
Valgrind has a number of options. It reads its options from four places, in order, so you can set up your own debugging environment: the file ~/.valgrindrc, the environment variable $VALGRIND_OPTS, the file ./.valgrindrc and the command line.
Valgrind isn't perfect, and it has a number of limitations beyond slowing down a program. The authors have listed the following constraints. See if they apply to you. It runs with x86-GNU/Linux ELF dynamically linked binaries, on a kernel 2.4.X or 2.6.X system, with the following caveats:
3DNow instructions are not implemented.
Pthreads have significant limitations.
The floating point registers should not be used for memory-to-memory copies.
If your program does its own memory management instead of using the standard management, then Valgrind's memory checking is limited.
Valgrind's supplies only basic POSIX-compliant sigaction and sigprocmask functionality.
Switching stacks can cause problems.
x86 instructions and system calls translation have been implemented in an on-demand basis. Thus, a program may fail during execution with an unimplemented instruction or system call.
x86 floating point works correctly but may run quite slowly.
Running under Valgrind increases you memory footprint.
Valgrind can handle dynamically generated code just fine. However, if you regenerate code over the top of old code (that is, at the same memory addresses) Valgrind does not realize the code has changed and runs its old translations, which are be out-of-date. You need to use the VALGRIND_DISCARD_TRANSLATIONS client request in that case. For the same reason GCC's trampolines for nested functions currently are unsupported; see bug 69511.
Emacs is known not to work with Valgrind because Emacs has its own memory-management scheme. Emacs works fine if you build it using the standard malloc/free routines.
On Red Hat 7.3, there have been reports of link errors (at program start time) for threaded programs using __pthread_clock_gettime and __pthread_clock_settime.
The simple program below shows what Memcheck and Addrcheck can do. It is interesting to compare the output from each tool.
// simple test for valgrind

#include <new>
#include <iostream>

using namespace std;

const int N=10;              // # of elements in array

int main() {
  cout << "Start of tests" << endl;
  int *p1 = new int(1);      // use to cause leak
  int *p2 = new int[N];      // allocate an int array
  int *p3 = new int(2);      // used to test wrong delete
  char *cp = 0;              // cp is null pointer
  char ca[3];                // unintialized array
  cout << "Test 1: off by one" << endl;
  for (int i=1; i<N+1; i++)  // one-off in loop
    p2[i] = i;               // err - initialize element p[N]
  cout << "Test 2: access freed storage" << endl;
  delete p1;
  *p1 = 3;                   // err - accessing freed storage
  cout << "Test 3: using uninitialized storage" << endl;
  if (p2[0]) cout << "Junk" << endl;// err - used uninit data
  cout << "Test 4: delete array using scalar delete" << endl;
  delete p2;                 // err - delete array with scalar delete
  cout << "Test 5: array delete of scalar" << endl;
  delete [] p3;              // err - array delete of scalar
  cout << "Test 6: overlapping storage blocks" << endl;
  memcpy( ca, &ca[1],2 );    // err - overlapping storage blocks
  cout << "Test 7: system call using uninitialize data" << endl;
  sleep( ca[0] );            // err - uninit data in system call
  cout << "Test 8: assign to null pointer - seg faults" << endl;
  *cp = 'a';                 // err - used null pointer (Seg fauilts)
  cout << "End of tests" << endl;
  return 0;
}
Using the command
valgrind --tool=memcheck --leak-check=yes --show-reachable=yes vgtest.cpp
I produced the following (slightly edited) output:
Start of tests
Test 1: off by one
==557== Invalid write of size 4
==557==    at 0x804894A: main (vg0.cpp:17)
==557==  Address 0x1BB2E088 is 0 bytes after a block of size 40 alloced
==557==    at 0x1B905220: operator new[](unsigned)
==557==    by 0x80488E1: main (vg0.cpp:11)
Test 2: access freed storage
==557==
==557== Invalid write of size 4
==557==    at 0x804898B: main (vg0.cpp:20)
==557==  Address 0x1BB2E028 is 0 bytes inside a block of size 4 freed
==557==    at 0x1B90552F: operator delete(void*)
==557==    by 0x8048984: main (vg0.cpp:19)
Test 3: using unitialized storage
==557==
==557== Conditional jump or move depends on uninitialized value(s)
==557==    at 0x80489BD: main (vg0.cpp:22)
Test 4: delete array using scalar delete
==557==
==557== Mismatched free() / delete / delete []
==557==    at 0x1B90552F: operator delete(void*)
==557==    by 0x8048A15: main (vg0.cpp:24)
==557==  Address 0x1BB2E060 is 0 bytes inside a block of size 40 alloced
==557==    at 0x1B905220: operator new[](unsigned)
==557==    by 0x80488E1: main (vg0.cpp:11)
Test 5: array delete of scalar
==557==
==557== Mismatched free() / delete / delete []
==557==    at 0x1B9056CD: operator delete[](void*)
==557==    by 0x8048A4F: main (vg0.cpp:26)
==557==  Address 0x1BB2E0B8 is 0 bytes inside a block of size 4 alloced
==557==    at 0x1B904FD8: operator new(unsigned)
==557==    by 0x80488F1: main (vg0.cpp:12)
Test 6: overlapping storage blocks
==557==
==557== Source and destination overlap in memcpy(0xBFE0D0, 0xBFE0D1, 2)
==557==    at 0x1B904AC5: memcpy (mac_replace_strmem.c:113)
==557==    by 0x8048A8B: main (vg0.cpp:28)
Test 7: system call using uninitialize data
==557==
==557== Conditional jump or move depends on uninitialized value(s)
==557==    at 0x1BA9D80C: sleep (in /lib/tls/libc.so.6)
==557==    by 0x8048AC1: main (vg0.cpp:30)
Test 8: assign to null pointer - seg faults
==557==
==557== Invalid write of size 1
==557==    at 0x8048AEE: main (vg0.cpp:32)
==557==  Address 0x0 is not stacked, malloced or (recently) freed
==557==
==557== Process terminating with default action of signal 11 (SIGSEGV)
==557==  Access not within mapped region at address 0x0
==557==    at 0x8048AEE: main (vg0.cpp:32)
==557==
==557== ERROR SUMMARY: 8 errors from 8 contexts (suppressed: 17 from 1)
==557== malloc/free: in use at exit: 0 bytes in 0 blocks.
==557== malloc/free: 3 allocs, 3 frees, 48 bytes allocated.
==557== For counts of detected errors, rerun with: -v
==557== No malloced blocks -- no leaks are possible.
Valgrind prefixes its output with the generated process ID, ==557== in this example, of the running program.
Reg. Charney has been a techie, an entrepreneur and businessman. He also has been a long-time Linux enthusiast and now is developing a series of business applications for Linux. His favorite language is Python.
