
Munin—the Raven Reports
The long-term monitoring tool Munin was developed in Norway, and its name is derived from Norse mythology. One of the two ravens who report the news of the world to the god Odin is called Munin, and the other is named Hugin. Munin is “memory”, and Hugin is “thought”.
The cool thing about the Munin long-term monitoring suite is that it's not restricted to supervising only typical system and network parameters. For example, you easily could do your colleagues from the marketing department a favor and monitor product sales for them. All you need to do is to write a script or program in the language of your choice that returns the current value of the monitored parameter in the form <parameter>.value <value> (ending with a newline character) on the standard output.
It's a little less trivial to understand how Munin actually works. This is because older parts of the official documentation (including the source code written in Perl) claim that Munin was a client-server application, which has caused much confusion. More recently, the Munin developers have referred to it as having a master-node architecture, which is far more appropriate.
To use the monitoring software, you need a machine that hosts a Web server and has Tobias Oetiker's RRDtool installed. On this computer, you run your Munin central, the Munin master. Debian and Ubuntu users will find it in the munin package. It consists of a set of Perl scripts to be run by the cron dæmon in five-minute intervals. These scripts collect data from several Munin nodes, archive them in round-robin databases (RRDs), generate diagrams and update the Web pages that present them. One of them, dubbed munin-limits, also warns about values that violate limits, if configured accordingly.
RRDs have the advantage of never changing size. As time goes by, older data is squashed and stored in less detail until it finally phases out completely. Munin uses RRDs that store the data from the past 48 hours in five-minute resolution. Average values for the past ten days are stored with a resolution of half an hour; average values for the past 46 days are stored with a resolution of two hours, and average values for the past 449 days are stored with a resolution of one day.
The Munin master reads the munin.conf configuration file usually placed in /etc/ (under Debian/Ubuntu, /etc/munin/munin.conf) to find out where to ask for data and under which (host)name it should appear in the Web interface. A typical configuration entry looks like this:
[Airport;localhost.localdomain]
    address 127.0.0.1
    use_node_name yes
In brackets, you put the name of the machine to be monitored (here, localhost.localdomain). If you use a Fully Qualified Domain Name (FQDN), Munin automatically will present this machine as a member of a group named after the given domain part. If you prefer to use your own groups, add the relevant group name in front of the machine name in brackets (here, Airport; the result is shown in Figure 1).
Make sure you use a semicolon as the delimiter, without any whitespaces before and after, and decide on the group name before you start monitoring. This will make life easier for you, as Munin uses the group name as the name of the directory that contains the round-robin databases and the diagrams (in our example, on an Ubuntu system, /var/www/munin/Airport/).
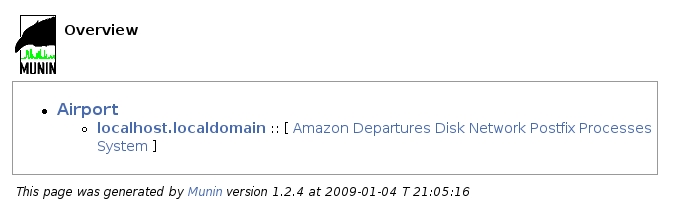
Figure 1. Munin's main page presents all plugins ordered by group and, within a group, by hostname. Categories available for each host are presented in brackets.
The filenames of the databases and diagrams contain the hostname given in brackets. If you change the content of the brackets afterward, make sure to change file and directory names accordingly (and before the next five-minute interval is over); otherwise, Munin will use new empty RRDs, and you may lose data.
Use the address parameter to specify the Internet address from which the Munin master obtains the relevant data. This allows you to use an intermediate slave machine to gather data from the actual target machines without giving misleading information in the Munin Web interface.
What seems to complicate matters at first glance is actually a very useful feature, as it allows you to restrict the plain-text communication of the Munin protocol to trusted machines. In addition, you do not always have the opportunity to install the Munin node software on the actual target machine. This is, for example, the case if a Munin node gathers data via SNMP. In this case, you must set the use_node_name parameter to no.
On each machine given as the value for an address parameter, you need to install the Munin node software; otherwise, the Web pages generated by the Munin master will remain empty. On Debian/Ubuntu systems, the relevant package is called munin-node.
The Munin node consists of a dæmon that, on request from the Munin master, starts the plugins responsible for collecting their specific type of data. Its configuration file, munin-node.conf, is stored in the same directory as the munin.conf; don't confuse the two if your Munin master runs on a machine that also acts as a node. munin-node.conf defines, among other things, the log file and log level, the port to be used (usually 4949), and most important, the machines that are allowed to connect to the dæmon:
allow ^127\.0\.0\.1$
In this case, the regular expression ^127\.0\.0\.1$ restricts access to the Munin master running on the same machine, localhost.
Installing the Munin node from a distribution package usually will activate a range of plugins that can be configured automatically. In this case, Telnetting to port 4949 of the node machine will give you an overview:
$ telnet localhost 4949
Trying 127.0.0.1...
Connected to localhost.localdomain.
Escape character is '^]'.
$ munin node at extrablatt.trish.de
help
$ Unknown command. Try list, nodes, config, fetch, version or quit
list
  open_inodes         if_err_eth0  irqstats
  entropy             processes    postfix_mailqueue
  if_eth0 df          netstat      interrupts
  swap                load         cpu
  df_inode            if_eth1      if_err_eth1
  postfix_mailvolume  forks        iostat
  open_files          memory       vmstat

fetch open_inodes
used.value 67839
max.value 68094
.
Connection closed by foreign host.
The list command returns the names of all activated plugins on this particular node. The fetch command, with the name of the plugin you want to run as an argument, returns the values of the parameters (in this case, used and max) the plugin monitors. As long as you don't change the timeout directive in munin-node.conf (for example, to 20 seconds: timeout 20), you have to be fast to type in your commands, as the dæmon will close the connection after a default of ten seconds.
If the list command does not list any plugins (which might be the case after a source code installation), you need to activate them first. To do this, symlink them into the plugins directory (/etc/munin/plugins on Debian/Ubuntu) on the node machine and restart the dæmon using its init script. The command munin-node-configure --shell will show you link commands for some of the plugins provided with the distribution.
There are two types of plugins. For plugins that are independent of additional parameters, the link name equals the plugin name. Sometimes, however, a plugin can monitor several items of the same type, for example, several network interfaces, such as eth0 and eth1.
In this case, it would be stupid to hard-code the interface name into the plugin. Instead, you provide this information in the name of the symlink. Plugins capable of this are called wild-card plugins, and their names end with an underscore. If you, for example, want to monitor the eth0 interface with the wild-card plugin if_, the link pointing to the if_ plugin would be if_eth0:
$ ls -al /etc/munin/plugins/if_eth*
lrwxrwxrwx 1 root root 28 2008-06-27 23:53
 ↪/etc/munin/plugins/if_eth0 -> /usr/share/munin/plugins/if_

lrwxrwxrwx 1 root root 28 2008-06-27 23:53
 ↪/etc/munin/plugins/if_eth1 -> /usr/share/munin/plugins/if_
Almost all plugins provided with the Munin distribution belong to the plugin family auto and can be run with the autoconf argument. In this case, they check whether they are able to provide meaningful results. For example, running a monitoring plugin for the Exim MTA makes sense only if you're running the Exim mail server. If your system does not fulfill the prerequisites to run a specific autoconf-enabled plugin, it will provide you with meaningful hints:
$ /usr/share/munin/plugins/exim_mailqueue autoconf
no (exim not found)
To get an overview of all preinstalled plugins that implement the autoconf method, simply run:
# munin-node-configure --suggest
Plugin                     | Used | Suggestions
------                     | ---- | -----------
[...]
exim_mailqueue             | no   | [exim not found]
[...]
if_                        | yes  |
[...]
If you want to share your own plugins with others, for example, at the Munin Exchange platform, we recommend you have a look at the officially provided plugins to see how the autoconf method is implemented. But, to get started with your own plugins, don't complicate your life unnecessarily.
As an example, let's monitor the departures at Munich Airport in five-minute intervals, as that is the default for the Munin cron job. The departure timetable is available from a Web page, and we can use a shell script and the Links text browser to dump it into a temporary file:
#!/bin/sh

SITE=http://www.munich-airport.de
DEP_URL=$SITE/en/consumer/fluginfo/abflug/index.jsp?viewType=t
TMP_FILE=/tmp/.muc_flights

links -dump $DEP_URL > $TMP_FILE
This file now contains lines like these:
[...]
 [ LH 3464 ] [ Budapest ]   [ 21:30 ] [  ]   [ T2 ]   [ departed ]
 [ LH  726 ] [ Shanghai ]   [ 21:30 ] [  ]   [ T2 ]   [ boarding ]
[...]
The Web page lists five flight states: calling, boarding, departed, planned (which means delayed) and cancelled. We will count them for the current time interval and return them on the standard output, like this:
calling.value 0
boarding.value 1
departed.value 1
planned.value 0
cancelled.value 0
To determine the current time, we could use the following date command:
$ date +%H:%M
21:30
and grep for this string in the “links” dump. Unfortunately, matters are a bit more complicated. The airport's departure timetable lists all flights in five-minute slots. But, even though the cron job on the Munin master is configured to run at zero, five, ten (and so on) minutes past the hour, we can't be sure it will run exactly on time. That's why our plugin uses a modulo operation (executed by bc) to round down the current minutes accordingly and combine hour and minutes in a case construction:
TIME=$(date +%H)
MIN=$(echo "($(date +%M)/5)*5"|bc)
case $MIN in
    0) TIME=$TIME:00   ;;
    5) TIME=$TIME:05   ;;
    *) TIME=$TIME:$MIN ;;
esac
Now the TIME variable contains only hour:minute pairs in which the minutes are a multiple of five.
There's another complication—when the Munin master stores the values retrieved from the plugin in the relevant RRDs at a point in time deviating from the exact planned time that RRDtool interpolates them. This way the database rarely contains the integer values our plugin returns but slightly deviating floating-point values.
The good news is that RRDtool accepts time value pairs. In this case, it will refrain from interpolation. The time must be given in seconds since January 1, 1970 00:00:00 UTC as a prefix of the value. A colon (:) is used as the delimiter, as in the following example plugin output:
calling.value 1230841800:0
boarding.value 1230841800:1
departed.value 1230841800:1
planned.value 1230841800:0
cancelled.value 1230841800:0
(1230841800 equals January 1, 2009, 21:30.) Note that Munin versions before 1.3.4 were unable to handle plugin output using this extended format. This means the following plugin code won't be compatible with older Munin versions:
links -dump $DEP_URL | grep $TIME > $TMP_FILE

UNIXTIME=$(date -d$TIME:00 +%s)
echo "calling.value $UNIXTIME:$(grep calling $TMP_FILE | wc -l)"
echo "boarding.value $UNIXTIME:$(grep boarding $TMP_FILE | wc -l)"
echo "departed.value $UNIXTIME:$(grep departed $TMP_FILE | wc -l)"
echo "planned.value $UNIXTIME:$(grep planned $TMP_FILE | wc -l)"
echo "cancelled.value $UNIXTIME:$(grep cancelled $TMP_FILE | wc -l)"
Apart from the output to be generated when the plugin is run without further arguments, all plugins are required to implement a config method, which is executed when the plugin is run with the config string as an argument. If we name our script muc (the abbreviation for Munich Airport) and start it from the directory where it is located, it might, for example, produce the following output:
$ ./muc config
graph_title Departures Munich Airport
graph_vlabel Number
graph_args --base 1000 --lower-limit 0
graph_category Departures
calling.label Calling
calling.draw AREA
boarding.label Boarding
boarding.draw STACK
departed.label Departed
departed.draw STACK
planned.label Late
planned.draw LINE2
cancelled.label Cancelled
cancelled.draw LINE2
Each time the Munin master asks the Munin node dæmon to run a plugin using the fetch command (as presented in the Telnet session above), it also executes the config method in order to find out how it should display the data in the diagram. In this example, the graph should be titled “Departures Munich Airport” (Figure 2), and the y-axis should be labeled “Number”.
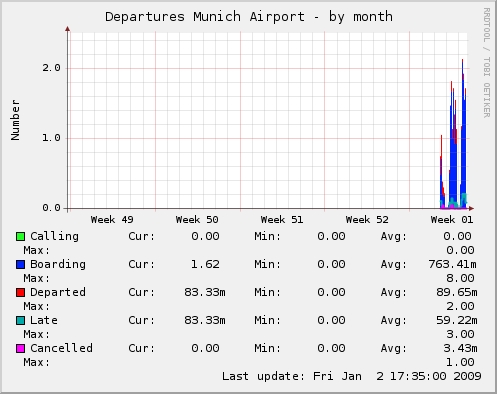
Figure 2. Departures from Munich Airport, January 2, 2009
The graph_args variable allows the plugin to forward arguments to the RRDtool graphing routine (see the rrdgraph man page). Forwarding the option --base 1000, the muc plugin ensures that a k (kilo) unit prefix as displayed in the graph equals 1000, not 1024. The -lower-limit 0 influences RRDtool's autoscaling. It makes sure that the displayed y-axis always will range at least from 0.
The graph_category tells the Munin master in which category (Figure 1) the relevant diagrams are to be displayed. This allows you to group diagrams in a logical way. The diagrams of plugins that do not specify the graph_category variable can be found in the “Other” category. The muc data will be presented in our own new category titled Departures.
In addition to these variables related to the entire graph, you also can specify details for each parameter the plugin monitors, so in the case of the muc plugin, calling, boarding, departed, planned and cancelled. The <parameter>.label variable sets the legend entry for <parameter>.
<parameter>.draw specifies the type of diagram the <parameter> data is to be presented as. AREA asks the Munin master to draw the relevant curve and fill the entire area between the x-axis and data point with color. Parameter data of the drawing type STACK will be stacked on top of this basic area. This way, we sum up all flights that, in the current five-minute interval, are labeled calling, boarding and departed. The airport timetable won't correct their departure time later; they all count as dispatched at this point of time.
Flights tagged as planned and cancelled behave differently. For delayed flights, the Munich Airport authorities will issue a new departure time later. This way, the plugin will see planned flights twice: as planned within their time slot according to schedule, and as calling, boarding or departed at their actual time interval of departure. That's why we draw delayed flights in a separate line of the type LINE2. The number denotes the thickness of the line in pixels. A LINE1 line is one pixel thick; a LINE2 line is two pixels, and a LINE3 line is three pixels. Cancelled flights won't reappear in the time schedule, but as they will never depart, we also draw them as a separate line of two pixels thick.
All this plugin output is written to the standard output. The final version of our muc script is shown in Listing 1.
Listing 1. muc Munin Plugin Script
SITE=http://www.munich-airport.de
DEP_URL=$SITE/en/consumer/fluginfo/abflug/index.jsp?viewType=t
TMP_FILE=/tmp/.muc_flights

if test "$1" = "config"; then
    echo graph_title Departures Munich Airport
    echo graph_vlabel Number
    echo graph_args --base 1000 --lower-limit 0
    echo graph_category Departures
    echo calling.label Calling
    echo calling.draw AREA
    echo boarding.label Boarding
    echo boarding.draw STACK
    echo departed.label Departed
    echo departed.draw STACK
    echo planned.label Late
    echo planned.draw LINE2
    echo cancelled.label Cancelled
    echo cancelled.draw LINE2
else
    TIME=$(date +%H)
    MIN=$(echo "($(date +%M)/5)*5"|bc)
    case $MIN in
        0) TIME=$TIME:00 ;;
        5) TIME=$TIME:05 ;;
        *) TIME=$TIME:$MIN ;;
    esac

    TMP_FILE=$TMP_FILE:$TIME
    links -dump $DEP_URL | grep $TIME > $TMP_FILE

    UNIXTIME=$(date -d$TIME:00 +%s)
    echo "calling.value $UNIXTIME:$(grep calling $TMP_FILE | wc -l)"
    echo "boarding.value $UNIXTIME:$(grep boarding $TMP_FILE | wc -l)"
    echo "departed.value $UNIXTIME:$(grep departed $TMP_FILE | wc -l)"
    echo "planned.value $UNIXTIME:$(grep planned $TMP_FILE | wc -l)"
    echo \
      "cancelled.value $UNIXTIME:$(grep cancelled $TMP_FILE | wc -l)"

    rm $TMP_FILE
fi
To activate the muc plugin, we simply create a symlink in the plugins directory and restart the Munin dæmon:
# ln -s <path/to/>muc /etc/munin/plugins
# /etc/init.d/munin-node restart
By Telnetting from the Munin master machine to port 4949 of the node machine on which we have activated the muc plugin, we can check whether all is well. Let's see if our config method works:
$ telnet localhost 4949
[...]
config muc
graph_title Departures Munich Airport
graph_vlabel Number
[...]
cancelled.label Cancelled
cancelled.draw LINE2
If we can do this by hand, the Munin master should generate some nice little graphs and present them via the Web, as shown in Figure 3.
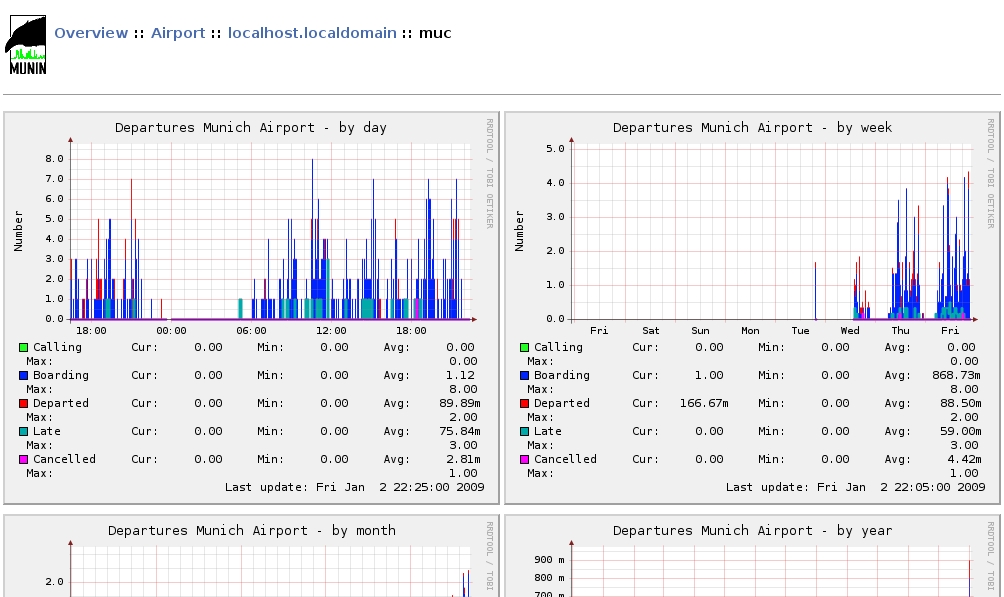
Figure 3. Munin creates daily, weekly, monthly and annual graphs. If you want to preserve them for later comparison, you can write a cron job that archives the relevant PNGs and/or RRD databases at certain points of time.
The simple way to write and integrate custom plugins is one of the huge advantages of Munin—even the more complex wild-card plugins are no big deal.
Unfortunately, simple sometimes also means simplistic. Although it is possible to include Munin-generated diagrams in customized Web pages, Munin does not provide any functionality to customize the Web pages generated by the Munin master. Especially on sites with many hosts and plugins to monitor, the simple approach that combines all daily and weekly graphs in one page results in an extremely slow-loading overview page.
Another example of a rigid approach in the Munin architecture is the fixed resolution of data. Not all data changes fast enough that the five-minute interval is appropriate.
Unfortunately, a configuration option for individual plugins remains an item on the wish list. On the other hand, Munin allows quite powerful configuration for plugins by means of environment variables set in the /etc/munin/plugin-conf.d/ directory.
Because the documentation could be more extensive, and because the code isn't well commented, the English and German users' mailing lists remain helpful resources.
Resources
Munin: munin.projects.linpro.no
Integration with Nagios: munin.projects.linpro.no/wiki/HowToContactNagios
RRDtool: oss.oetiker.ch/rrdtool
Munin Exchange: muninexchange.projects.linpro.no
rrdgraph man page: oss.oetiker.ch/rrdtool/doc/rrdgraph.en.html
Patricia Jung (trish+lj@trish.de) works as a freelance technical writer, editor, community manager and system administrator specializing in open-source topics from Munich/Germany.

