
Use Inkscape and XSLT to Create Cross-Platform Reports and Forms
I work for a health-care company developing application software. My colleagues and I are responsible for writing software to process health-care claims, manage work flow and make the company as efficient as possible. We recently decided to replace a piece of third-party software that took health-care claim data and overlaid it on standard HIPAA (Health Insurance Portability and Accountability Act) claim forms. The software would take the data and transpose it into PDF files that we stored on a large file server. Each PDF contained one claim on its proper form. We made the decision to replace the software because we needed something more agile. We wanted something that would create the claim image dynamically and not consume space on our servers.

Figure 1. Health Insurance HCFA 1500 Claim Form
Health-care claims are very intricate (Figure 1). Many boxes and boilerplate text have to be drawn. The conventional way to do this with a software application is to draw a series of lines using coordinates and lengths, and then lay the static and dynamic content on top of the newly drawn lines. The process of programming an application like this is long and tedious, not to mention error-prone. We wanted something that was easier to create and maintain. Our requirements were as follows:
We must be able to print high-quality versions of the claims.
Claims must be accessible from a Web browser.
The solution has to be programming language-independent. We use Python, PHP, Perl and Java. The images need to be created using any of these languages.
We must be able to convert the claim data and form into several different file formats, specifically PDF and PNG.
The entire solution must be platform-independent.
After reviewing the requirements, we looked at several different open- and closed-source options. None of them met all of our requirements, so we turned to creating our own solution. We tried scanning a blank claim form and using ImageMagick to put the claim data on it. This almost gave us what we wanted. The problem was that it was going to be tedious and redundant to create the solution in all of the required languages. Next, we turned to FOP (Formatting Objects Processor). This solution was closer to what we wanted. However, it would take too long create the claim forms. Plus, the solution was not really language-independent either (FOP is a Java library). We could have written wrappers for the FOP command-line interface, but we were convinced that there was still a better solution.
While exploring the FOP solution, we had the idea of using Scalable Vector Graphics (SVGs). Basically, we would take an SVG image of the claim form and make it into an XSLT (eXtensible Stylesheet Language Transformation), because the SVG format is a special XML format. Then, we would pull the claim data from our database and convert it into an XML string. Using any of our languages, we could then take the XSLT and the XML and create an SVG image of the claim. This solution met all of our requirements. It was language- and platform-independent. We could print the SVG images and embed them into Web pages. Furthermore, SVG images can be converted into different file formats easily. Another nice feature of this solution is the small file size of the SVG images. If we wanted to archive the images, they would take a fraction of the space the old solution did. Because SVG images are text, not compressed binary, the files can be compressed and save even more space.
One of the things that made the SVG solution so appealing was how easy it would be to create and maintain the master SVG image of the form. To do this, we would use Inkscape. Inkscape is an SVG-authoring tool that works on Linux, Mac OS X, Windows and other UNIX-like operating systems. Other SVG-authoring tools are available, but we chose Inkscape because it is open, and it is in the package manager for most Linux distributions.
The first thing we did to create the master SVG was open Inkscape and create a new US Letter size document. To keep things organized, we created four layers in the new document: scan, overlay, boilerplate and dynamic text. Using the scan layer, we imported a scan of a claim. Doing this allowed us to line up everything on the Inkscape stage without having to measure anything. After importing the image, we locked the layer so that it could not be modified accidentally. Actually, after we were finished with each layer on the SVG, we would lock it to ensure it was not tampered with.
Next, we used the overlay layer to trace all the lines and boxes from the original claim that we imported. This step was a little tricky. When the image we scanned was originally created, the lines were not spaced evenly for one reason or another. We decided to line up things correctly on our version. Fortunately, Inkscape has tools to do this automatically. By selecting all of the objects that needed to be spaced out (Shift-left-click) and using the Align and Distribute dialog (Object→Align and Distribute in the menu), Inkscape fixed the spacing issues. When finished, we had something that looked like Figure 2.
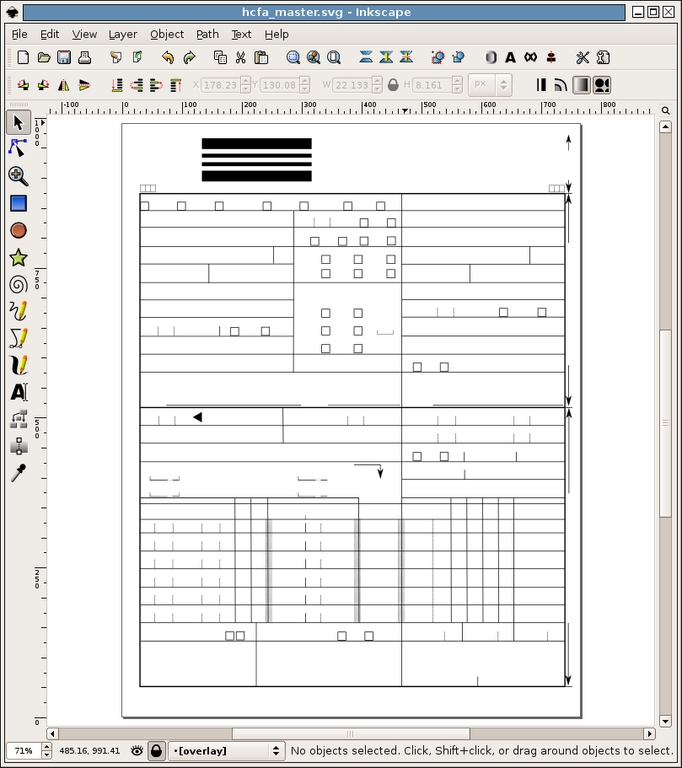
Figure 2. A Trace of the Lines and Boxes from the Claim Form
After drawing all of the lines, it was time to add all the boilerplate text. For this, we used the aptly named boilerplate layer. Before we got started, we decided to remove the scan layer completely, because we no longer needed it. To align the text properly, we used the Guides in Inkscape. Guides are exactly what the name suggests—guide lines that exist only inside of Inkscape for the purpose of aligning objects. To use a guide line, simply click the top or left-hand margin and drag the line into place. To get the most out of the guide lines, we enabled the Snap points to guides feature (File→Document Preferences→Guides). Doing this allowed us to place all of the text exactly in alignment. Figure 3 shows what the SVG looked like after this step.
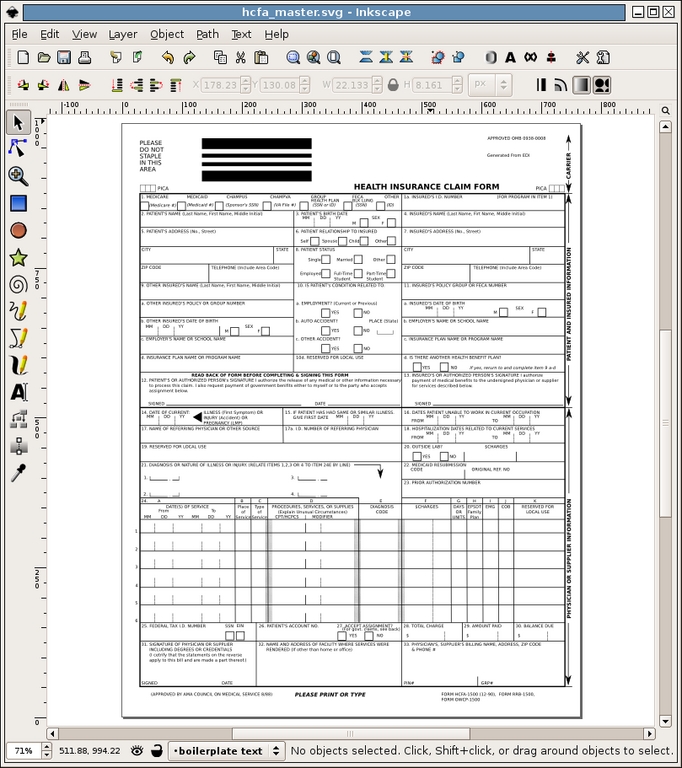
Figure 3. The Blank Claim Form Completed
Finally, we switched to the dynamic text layer and added placeholders where the claim data would be located. Again, we used the guides to align everything. For the text place holders, we used a single $ for each block of text. Then, to make life easier down the road, we renamed each of the dynamic text objects to something relevant. We did this by left-clicking on the object and going to Object→Object Properties in the menu. Figure 4 shows the final master SVG with the guide lines.
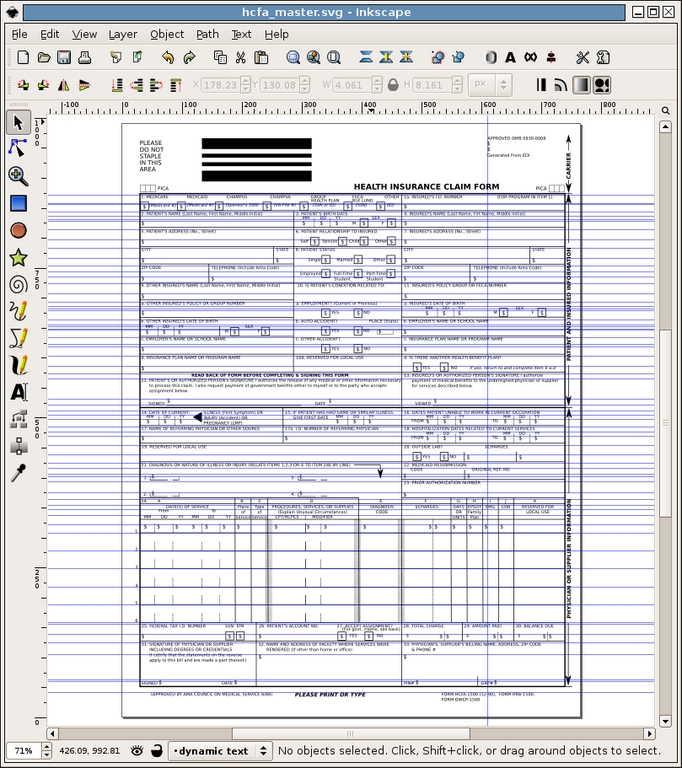
Figure 4. Final Master with Dynamic Text Layer
Creating the master SVG took about four full hours of work. I would venture to guess that it would have taken several days to do this programmatically.
Once we had the master SVG finished, it was time to convert it into an XSLT. Because SVG images are just XML files, we added all of the XSLT markup with a text editor. Converting the SVG was a rather simple matter. To make it a true XSLT, only a few lines are required in the header. Listing 1 shows a few lines of the SVG before we modified it. Listing 2 shows the same set of lines with the XSLT markup.
Listing 1. A Few Lines of the SVG before Modifying
<?xml version="1.0" encoding="UTF-8" standalone="no"?>
<!-- Created with Inkscape (http://www.inkscape.org/) -->
<svg
...
</svg>
Listing 2. The Same Set of Lines with the XSLT Markup
<?xml version="1.0" encoding="UTF-8" standalone="no"?>
<!-- Created with Inkscape (http://www.inkscape.org/) -->
<xsl:stylesheet version="1.0"
 ↪>
<xsl:template match="/claim">
<svg
...
</svg>
</xsl:template>
</xsl:stylesheet>
As you can see, there are four new lines. The first new line declares this file an XSLT. The second new line contains an XPath (XML Path Language) expression that matches the root element in our claim data XML. This line tells the XML transform engine where to start reading the XML to do the conversion. The last two new lines simply close the open xsl tags.
At this point, the XSLT can be used in conjunction with our claim data XML to produce an SVG. However, the resulting SVG would look just like the SVG did before we modified it. To make it actually show the claim data, we had to go into the XSLT and add all of the XPath expressions to populate the SVG. Because we divided the SVG objects into layers, we had to modify only the dynamic text layer. In the SVG XML, the dynamic text layer is nothing more than a series of text tags. Listing 3 shows the text tag for the Patient's City box on our claim form.
Listing 3. Text Tag for the Patient's City Box on the Claim Form
<text
    xml:space="preserve"
    style="..."
    x="33.237278"
    y="231.77995"
    id="textPatientCity"
    sodipodi:linespacing="125.00000%"
    inkscape:label="#text7272">
        <tspan
            sodipodi:role="line"
            id="tspan7274"
            x="33.237278"
            y="231.77995"><xsl:value-of
 select="patient/address/city"/></tspan></text>
When the XSLT is applied to the claim data XML, the value of /claim/patient/address/city will be substituted here. We went through the entire XSLT and added the appropriate XPath expressions where they belonged. In special cases, we also added XPath conditional logic and formatting rules.
As mentioned previously, all of our claim data was in a database—a Postgres database to be more specific. As we wanted a solution that was not language-specific, we had to devise a way to get the claim data out of the database and into an XML format without depending on a specific programming language. One of my fellow developers had the idea to write a series of PL/pgSQL functions to return a single XML string that contained the XML data. His solution was brilliant and fit the bill perfectly. All we needed to do to get the claim data was run one small query with the ID of the claim (Listing 4). The result was well-formatted XML that we used to make claim images.
At first, the primary point of creating this solution was to display claims in our Web interface. All of our Web applications are written in PHP5 and run in an Apache/mod_php environment. To do the XSLT transformation, we used the XSL functions in PHP. This set of functions comes as an extension to PHP. The extension is a front end to the libxslt C library.
The XSLT extension makes doing the transition easy. Listing 5 shows a portion of a PHP script that transforms the claim XML into an SVG and displays it in the browser.
Listing 5. A Portion of the PHP Script That Transforms the Claim XML into an SVG and Displays It in a Browser
// import the SVG XSLT
$xsl = new XSLTProcessor();
$xsl->importStyleSheet(DOMDocument::load("svg_xslt.xsl"));

// load the claim data XML
// $claim is the database result from Listing 4
$doc = new DOMDocument();
$doc->loadXML($claim);

// tell the browser this is an SVG document
header("Content-Type: image/svg+xml");

// print the SVG to the browser
echo $xsl->transformToXML($doc);
Listing 5 is a simplified version of our solution. In our solution, there is the possibility of having multiple pages for a single claim. To fix this, we had to do multiple transformations, one for each page. To get the multiple-page claims to display in the same browser window, we had to embed them. This can be done using the embed and object HTML tags. Note that there are several issues with browser compatibility when using these tags. To solve the compatibility issues, we wrote a script that checks the user's browser and decides which tag to use. Then, we set the target object data/embedded source to a script similar to the one in Listing 5. This allowed the Web browser to display multiple SVG images in the same window.
Other considerations must be made when using SVG images in a Web browser environment. Internet Explorer does not have native support for SVG images. The user is forced to use a third-party plugin to display the images. Adobe provides one of these for free. Mozilla Firefox has built-in support for SVG images starting with version 1.5. However, Firefox does not support several aspects of SVG images, such as scaling and grouped objects. Fortunately for us, all of our users use an up-to-date version of Firefox.
That is all there is to it. Figure 5 shows a claim image with all of the data filled in.
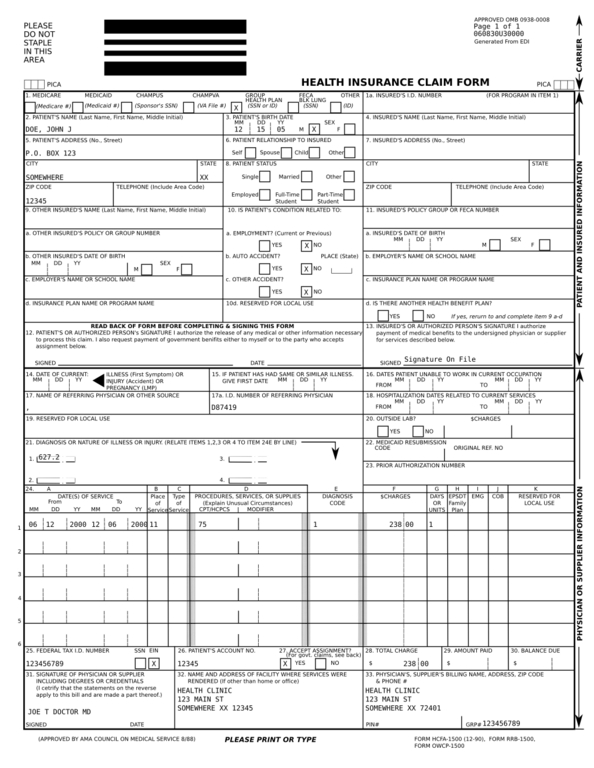
Figure 5. Claim Form with Sample Data
Once we finished the Web end of our solution, we turned our sights toward the rest of our integration. This meant we had to print the SVG images and find a way to archive them. Some clients request that we send them copies of the claims printed and/or electronically. Because all of our back-end software is written in Python, it also meant we had to do the XML transformation in a different language. To do all of the XML work, we used the 4Suite XML API.
To print the images, we again turned to Inkscape, because our PostScript printer drivers would not print the SVG images. Inkscape has a handful of command-line options that tell Inkscape to run in command-line mode, thus suppressing the graphical interface. The one we used to print is the -p option. This, combined with the lpr command, allowed us to print our images without any user interaction. Listing 6 shows how we did the same transform we did in Listing 5, except now in Python. The example also shows how we called Inkscape to print our claim images.
Listing 6. Same Transform as Shown in Listing 5, Except Using Python
from Ft.Xml.Xslt import Processor
from Ft.Xml import InputSource
from Ft.Xml.Domlette import NonvalidatingReader

// load the claim data XML
// claim is the database result from Listing 4
doc = NonvalidatingReader.parseString(claim, "http://spam.com/doc.xml")

// load and process the XSLT
xsl = InputSource.DefaultFactory.fromUri("file://svg_xslt.xsl")
processor = Processor.Processor()
processor.appendStylesheet(xsl)

// do the transformation
result = processor.runNode(doc, "http://spam.com/doc.xml")

// write the SVG to a file
f = open("/tmp/"+ claim +".svg", "w")
f.write(result)
f.close()

// print the image on the default printer
os.system("inkscape /tmp/"+ claim  +".svg -p | lpr")
Earlier, I mentioned we often have multiple pages per claim. When printing, this was not an issue; we simply would send each page to the printer as a separate job. When it came to archiving, we had to do something different. As with the Web interface, we had to group the pages, this time into a file, not a Web browser. When archiving, we had to store the files in PDF format, because that is what our clients wanted. To get the images into a PDF and combine the multiple page claims, we used Inkscape and Ghostscript.
As with printing, Inkscape has an option to export a file into PostScript format. Instead of using -p, we use -P and pass Inkscape the desired output filename. After all of the pages of a claim have been written to files, we use the following Ghostscript command to put the pages into a single PDF and archive them:
gs -dBATCH -dNOPAUSE -q -sDEVICE=pdfwrite -sOutputFile=out.pdf
/tmp/foo1.ps
/tmp/foo2.ps
Shortly after we finished the project, we were faced with making two rounds of changes to the layout of the form. The first round of changes dealt with the positioning of text objects. The second round was far more extensive—we had to draw a series of new boxes on the form to accommodate a new identification system. Because we could not open the modified SVG in Inkscape, we had to make our changes to the master SVG and then apply them manually to the XSLT version.
At first, we thought making the changes would be hard and tedious, but it turned out that the process was simple. For the first round, we simply made the changes in the master using Inkscape, careful to keep a note of the objects we changed. Then, using a text editor, we replaced the old portions of XML with the new ones in the XSLT. Because the second batch of changes was additions only, we decided simply to make another layer in the master to which to add the boxes. When we finished adding the new boxes, we simply copied the new layer into the XSLT using a text editor.
From start to finish, our project took a little more than a month to design, build, test and publish. Our solution has made all of our applications more agile and effective. We also have saved terabytes' worth of storage space on our servers.
Currently, the SVG adaptation rate is rather slow. We are looking forward to seeing what other tools will be built that utilize the versatile SVG file format.
Chad Files is a software developer who resides in Conway, Arkansas. He is an avid hiker and longtime Linux user. He welcomes your comments at cpfiles@gmail.com.
