
Chapter 4: Nagios Basics
The fact that a host can be reached, in itself, has little meaning if no service is running on it on which somebody or something relies. Accordingly, everything in Nagios revolves around service checks. After all, no service can run without a host. If the host computer fails, it also cannot provide the desired service.
Things get slightly more complicated if a router, for example, is brought into play, which lies between users and the system providing services. If this fails, the desired service may still be running on the target host, but it is nevertheless no longer reachable for the user.
Nagios is in a position to reproduce such dependencies and to precisely inform the administrator of the failure of an important network component, instead of flooding the administrator with irrelevant error messages concerning services that cannot be reached. An understanding of such dependencies is essential for the smooth operation of Nagios, which is why Section 4.1 will look in more detail at these dependencies and the way Nagios works.
Another important item is the state of a host or service. On the one hand Nagios allows a much finer distinction than just "ok" or "not ok"; on the other hand the distinction between (soft state) and (hard state) means that the administrator does not have to deal with short-term disruptions that have long since disappeared by the time the administrator has received the information. These states also influence the intensity of the service checks. How this functions in detail is described in Section 4.3.
How Nagios handles dependencies of hosts and services can be best illustrated with an example. Figure 4.1 represents a small network in which the Domain Name Service on proxy is to be monitored.
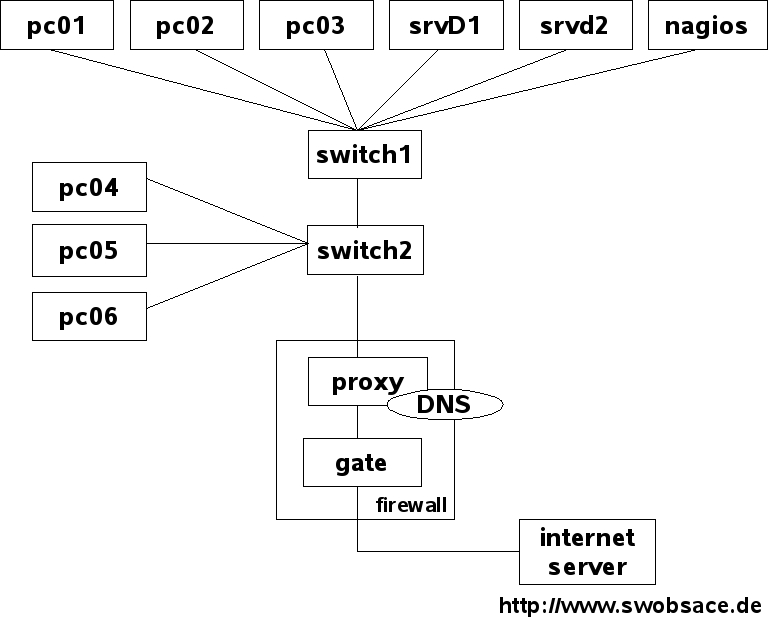
Figure 4.1: Topology of an example network
The service check always serves as the starting point for monitoring that is regularly performed by the system. As long as the service can be reached, Nagios takes no further steps; that is, it does not perform any host checks. For switch1, switch2, and proxy, such a check would be pointless anyway, because if the DNS service responds to proxy, then the hosts mentioned are automatically accessible.
If the name service fails, however, Nagios tests the computer involved with a host check, to see whether the service or the host is causing the problem. If proxy cannot be reached, Nagios might test the parent hosts entered in the configuration (Figure 4.2). With the parents host parameter, the administrator has a means available to provide Nagios with information on the network topology.

Figure 4.2: The order of tests performed after a service failure.
When doing this, the administrator only enters the direct neighbor computer fo each host on the path to the Nagios server as the parent.1 Hosts that are allocated in the same network segment as the Nagios server itself are defined without a parent. For the network topology from Figure 4.1, the corresponding configuration (reduced to the host name and parent) appears as follows:
define host{
    host_name  proxy
	...

  parents    switch2
}

define host{
    host_name  switch2
   ...

  parents    switch1
}

define host{
    host_name  switch1
      ...
}
switch1 is located in the same network segment as the Nagios server, so it is therefore not allocated a parent computer. What belongs to a network segment is a matter of opinion: if you interpret the switches as the segment limit, as is the case here, this has the advantage of being able to more closely isolate a disruption. But you can also take a different view and interpret an IP subnetwork as a segment. Then a router would form the segment limit; in our example, proxy would then count in the same network as the Nagios server. However, it would no longer be possible to distinguish between a failure of proxy and a failure of switch1 or switch2.
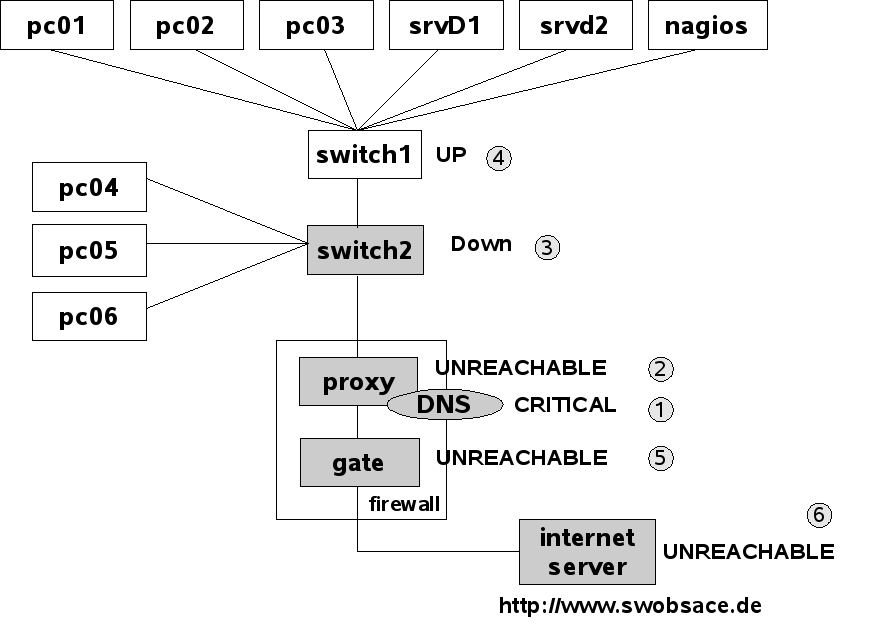
Figure 4.3: Classification of individual network nodes by Nagios.
If switch1 in the example fails, Figure 4.3 shows the sequence in which Nagios proceeds: first the system, when checking the DNS service on proxy, determines that this service is no longer reachable (1). To differentiate, it now performs a host check to see what the state of the proxy computer is (2). Since proxy cannot be reached, but it has switch2 as a parent, Nagios also subjects switch2 to a host check (3). If this switch also cannot be reached, the system checks its parent, switch1 (4).
If Nagios can establish contact with switch1, the cause for the failure of the DNS service on proxy can be isolated to switch2. The system accordingly specifies the states of the host: switch1 is UP, switch2 DOWN; proxy, on the other hand, is UNREACHABLE. Through a suitable configuration of the Nagios messaging system (see Section 12.3 on page 217) you can use this distinction to determine, for example, that the administrator is informed only about the host that is in the DOWN state and represents the actual problem, but not about the hosts that are dependent on the down host.
In a further step, Nagios can determine other topology-specific failures in the network (so-called network outages). proxy is the parent of gate, so gate is also represented as UNREACHABLE (5). gate in turn also functions as a parent; the Internet server dependent on this is also classified as "UNREACHABLE".
This "intelligence", which distinguishes Nagios, helps the administrator all the more, the more hosts and services are dependent on a failed component. For a router in the backbone, on which hundreds of hosts and services are dependent, the system informs administrators of the specific disruption, instead of sending them hundreds of error messages that are not wrong in principle, but are not really of any help in trying to eliminate the disruption.
Service checks are carried out regularly by Nagios, host checks only when needed. Although the check_interval parameter provides a way of forcing regular host checks, there is no real reason to do this. There is one reason not to do this, however: continual host checks have a considerable influence on the performance of Nagios.
If you nevertheless want to regularly check the reachability of a host, it is better to use a ping-based service check (see Section 6.2 from page 88). At the same time you will obtain further information such as the response times or possible packet losses, which provides indirect clues about the network load or possible network problems. A host check, on the other hand, also issues an OK even if many packets go missing and the network performance is catastrophic. What is involved here--as the name "host check" implies--is only reachability in principle and not the quality of the connection.
Nagios uses plugins for the host and service checks. They provide four different return values (cf. Table 6.1 on page 85): O (OK), 1 (WARNING), 2 (CRITICAL), and 3 (UNKNOWN).
The return value UNKNOWN means that the running of the plugin generally went wrong, perhaps because of wrong parameters. You can normally specify the situations in which the plugin issues a warning or a critical state when it is started.
Nagios determines the states of services and hosts from the return values of the plugin. The states for services are the same as the return values OK, WARNING, CRITICAL and UNKNOWN. For the hosts the picture is slightly different: the UP state describes a reachable host, DOWN means that the computer is down, and UNREACHABLE refers to the state of nonreachability, where Nagios cannot test whether the host is available or not, because a parent is down (see Section 4.1, page 72).
In addition to this, Nagios makes a distinction between two types of state: soft state and hard state. If a problem occurs for the first time (that is, if there was nothing wrong with the state of a service until now) then the program categorizes the new state initially as a soft state and repeats the test several times. It may be the case that the error state was just a one-off event that was eliminated a short while later. Only if the error continues to exist after multiple testing is it then categorized by Nagios as a hard state. Administrators are informed only of hard states, because messages involving short-term disruptions that disappear again immediately afterwards only add to an unnecessary flood of information.
In our example the chronological sequence of states of a service can be illustrated quite simply. A service with the following parameters is used for this purpose:
define service{
    host_name               proxy
    service_description     DNS
	...

     normal_check_interval   5
    retry_check_interval    1
    max_check_attempts      5

   ...
}
normal_check_interval specifies at what interval Nagios should check the corresponding service as long as the state is OK or if a hard state exists--in this case, every five minutes. retry_check_interval defines the interval between two service checks during a soft state--one minute in the example. If a new error occurs, then Nagios will take a closer look at the service at shorter intervals.
max_check_attempts determines how often the service check is to be repeated after an error has first occurred. If max_check_attempts has been reached and if the error state continues, Nagios inspects the service again at the intervals specified in normal_check_interval.
Figure 4.4 represents the chronological progression in graphic form: the illustration begins with an OK state (which is always a hard state). Normally Nagios will repeat the service check at five-minute intervals. After ten minutes an error occurs; the state changes to CRITICAL, but this is initially a soft state. At this point in time, Nagios has not yet issued any message.
Now the system checks the service at intervals specified in retry_check_interval, here this is every minute. After a total of five checks (max_check_attempts) with the same result, the state changes from soft to hard. Only now does Nagios inform the relevant people. The tests are now repeated at the intervals specified in normal_check_interval.

Figure 4.4: Example of the chronological progression of states in a monitored service
In the next test the service is again available; thus its state changes from CRITICAL to OK. Since an OK state is always a hard state, this change is not subject to any tests by Nagios at shorter intervals.
The transition of the service to the OK state after an error in the hard state is referred to as a hard recovery. The system informs the administrators of this (if it is configured to do so) as well as of the change between various error-connected hard states (such as from WARNING to UNKNOWN). If the service recovers from an error soft state to the normal state (OK)--also called a soft recovery--the administrators will, however, not be notified.
Even if the messaging system leaves out soft states and switches back to soft states, it will still record such states in the Web interface and in the log files. In the Web front end, soft states can be identified by the fact that the value 2/5 is listed in the column Attempts, for example. This means that max_check_attempts expects five attempts, but only two have been carried out until now. With a hard state, max_check_attempts is listed twice at the corresponding position, which in the example is therefore 5/5.
More important for the administrator in the Web interface than the distinction of whether the state is still "soft" or already "hard", is the duration of the error state in the column Duration. From this a better judgment can be made of how large the overall problem may be.
For services that are not available because the host is down, the entry 1/5 in the column Attempts would appear, since Nagios does not repeat service checks until the entire host is reachable again. The failure of a computer can be more easily recognized by its color in the Web interface: the service overview in Figure 4.3 (page 66) marks the failed host in red; if the computer is reachable, the background remains gray.
1 The parameter name parents can be explained by the fact that there are scenarios--such as in high availability environments--in which a host has two upstream routers that guarantee the Internet connection, for example.

