
64-Bit JMP for Linux
The world's largest privately owned software company, SAS, was cofounded in 1976 by Dr James Goodnight and John Sall. They continue to run the company as CEO and Executive Vice President. Sall is also chief architect of SAS's statistical discovery software called JMP (pronounced “jump”), which he invented for the Macintosh in the late 1980s. It is a desktop statistical analysis program using exploratory graphics to promote statistical discovery. JMP was released for Windows in 1995 and has been available for 32-bit Linux since 2003.
SAS's version 6.1 release of JMP later in 2006 harnesses the vast computational power of 64-bit Linux, which is not only exciting news for JMP and Linux, but is also a milestone in statistical computing.
To understand the importance of a 64-bit version of JMP, let us contemplate the purpose and history of statistical analysis.
Ultimately, the purpose of statistics is to make sense out of too much information. For example, the only possible way to digest the results of the United States census data every ten years, with its dozens of measurements on 275-million people, is by reducing it to statistical conclusions, such as the average household income by county and median age by city or neighborhood. Nobody could possibly look at the raw census data and draw a meaningful conclusion beyond “the United States has a large, diverse population”.
The problem is that there are hundreds and thousands of statistical measures—in fact, SAS has already spent 30 years extending and refining its analytical capabilities and doesn't see any end in sight. Learning what techniques to use for which real-world situations can take years, and developing the insights to proceed effectively from raw data to knowledge can take a lifetime. This is what led John Sall to develop JMP in the late 1980s. Inspired by the way the Macintosh made desktop computing accessible to a whole new audience by introducing a graphical user interface, Sall realized he could make statistics accessible to a wider audience by making the analysis process visual.
Comprehending the meaning buried in pages of statistical test results—p-values, standard deviations, error terms, degrees of freedom and on and on—is a mind-boggling task even for experts, but Sall knew that just about anyone could look at a well-drawn graph and understand things about his or her data. JMP always leads every analysis with graphs, so that researchers needn't waste time poring over statistics when those graphs make it intuitively obvious whether they are on the right analysis path or not. JMP also groups related analyses together and presents them in the order a researcher would need them in the course of a sound data exploration process. Researchers do not have to wrack their brains to remember which procedure might be helpful next. Instead, JMP provides the tools that are appropriate at each stage. Further, all of JMP's graphs and data tables are dynamically linked, so that users can point and click to select points in a graph or bars in a histogram and instantly see where those points are represented in all other open graphs and data tables.
Setting aside for a moment what it takes to understand statistics, consider what it takes to calculate statistics. For a researcher to compute a standard deviation on thousands of observations using only a pencil and paper could take weeks or months.
When he created SAS in the early 1970s, Jim Goodnight's idea was to store all that data in a file and then write procedures that could be used and reused to compute statistics on any file. It's an idea that seems ludicrously simple today, but it was revolutionary at the time. The agricultural scientists using SAS could perform calculations over and over again on new data without having to pay for computer scientists to write and rewrite programs. Instead of taking weeks, these computations took hours. Fast-forward 30 years, and modern statistical software can do these calculations on hundreds of thousands of rows, instantaneously.
When it took months to compute simple descriptive stats, researchers often didn't get much further before they'd burned through their grant money. Now that the basics take seconds, researchers can dig much deeper, and thus the science and practice of statistics have evolved along with computing power.
For the last decade, desktop computing has been built on operating systems such as Windows, Linux and Mac that rely on 32-bit memory addressing. Accordingly, desktop applications have operated within the computational limits implied by this architecture. In practical terms, this meant statistical programs like JMP that load the entire dataset into RAM before performing any computations were limited to about a million rows of data. They couldn't handle the large-scale problems confronting researchers today. Geneticists are probing 3-billion base pairs of DNA. Semiconductor manufacturers are squeezing millions of transistors onto ever-tinier chips. Pharmaceutical companies comb through thousands of potentially therapeutic properties on countless known and theoretical compounds.
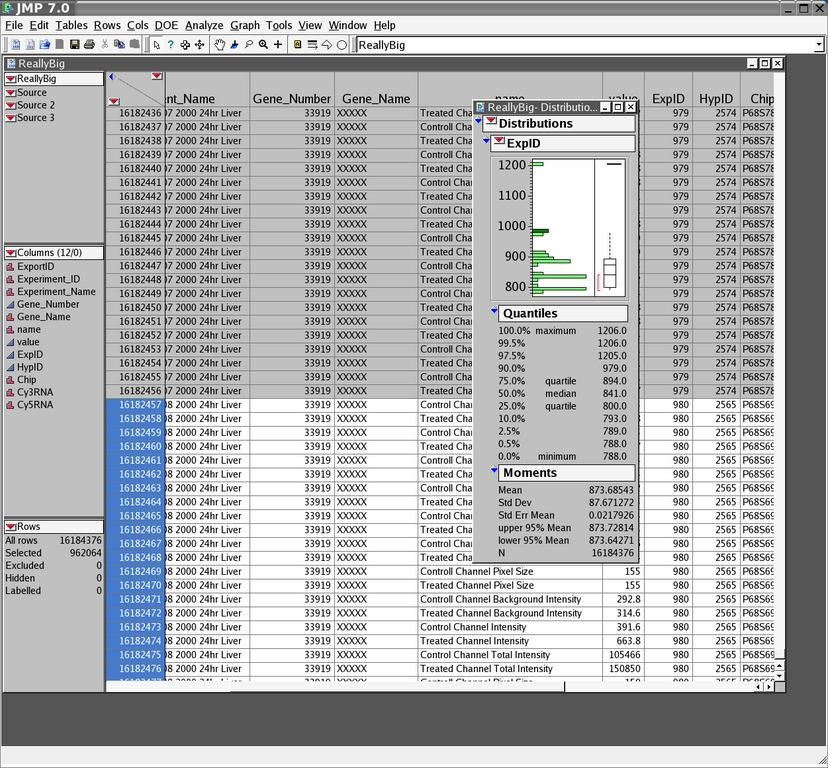
Figure 1. JMP Main Window Showing a Distribution for Genetics Data
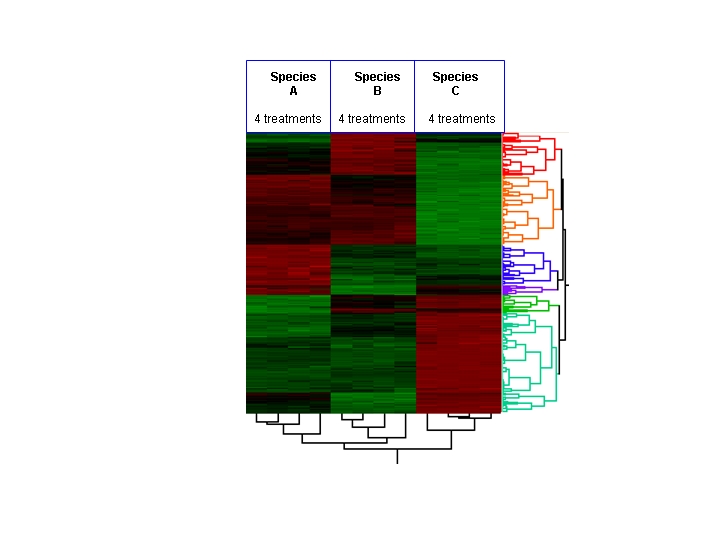
Figure 2. Hierarchical Cluster Diagram or “Heatmap” Showing Gene Expression, Protein and Metabolite Production Patterns
Dr Richard C. Potter, Director of Research and Development for JMP Product Engineering, was responsible for porting JMP from Macintosh to Windows and later from Windows to Linux, in collaboration with Paul Nelson, lead Linux System Developer. Potter says:
JMP's 64-bit Linux release lifts this limit dramatically. Now JMP can move beyond the confines of the 32-bit addressing memory limit to a theoretical limit of 16 exabytes, which would allow JMP to work on two-billion rows of data. The 64-bit Linux release of JMP is also multithreaded, and the size and complexity of the problems someone can solve using JMP is mind-boggling.
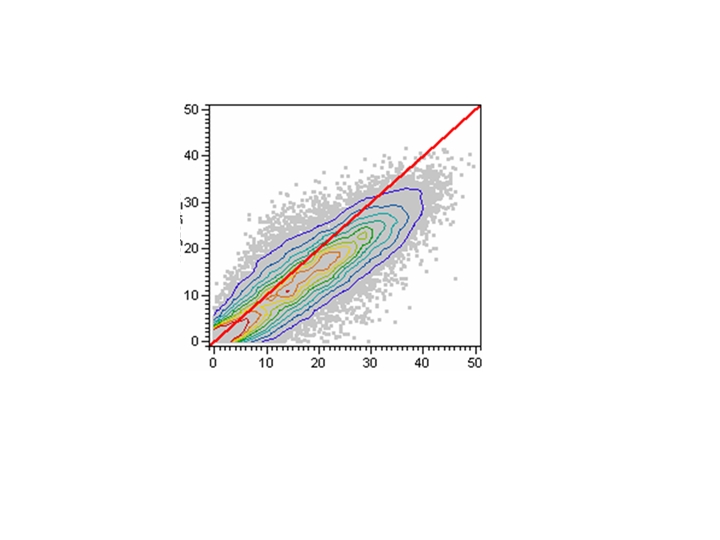
Figure 3. Bivariate Fit with Nonparametric Density Contours Representing Density Levels
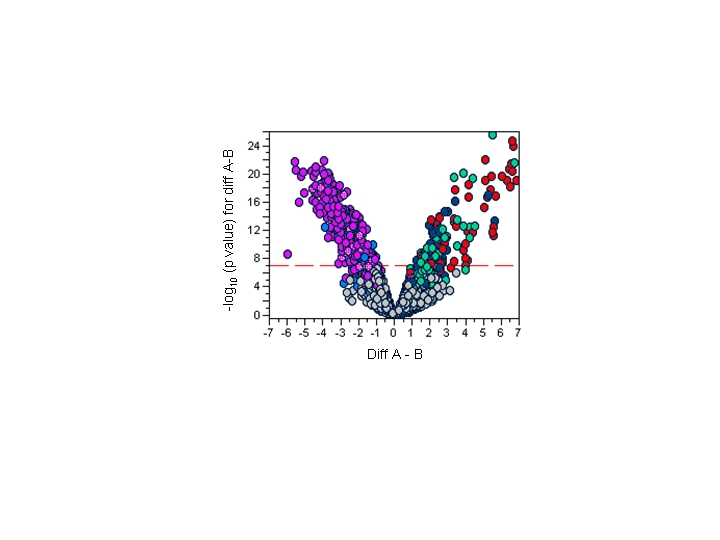
Figure 4. Bivariate Fit Volcano Plot for Comparing Gene Expression
One particular analytical strength of JMP sets it clearly apart from all other stats packages, open source or otherwise: its capabilities for design of experiment (DOE). The idea of experimental design goes beyond the traditional statistical concept of trying to learn from data that has already been collected, to an idea of planning how best to learn more by designing and running experiments.
Suppose you make tires by cooking various ingredients into rubber, combining that rubber with steel and other materials, then forming the rubber into tire-shaped molds of various dimensions and tread patterns. You might judge the success of those tires by measuring their traction in a variety of driving conditions, the range of operating temperatures and speeds they can endure, and the length of their usable lifetimes. You would be attempting to solve an impossibly complex problem. You would be trying to optimize at least four response measurements of varying importance and interactions that depend on an infinitely variable mixture of ingredients and countless combinations of cooking temperatures and times, molding pressures and times, tire dimensions and tread patterns. If you tried to optimize this manufacturing process using traditional methods, trying out every imaginable combination, you would be working for centuries and expending more natural resources than you could hope to collect.
Design of experiments offers a better way. By running a representative set of experiments that span the space of possibilities and using statistical modeling methods to interpolate and extrapolate those results, researchers can reduce the size of problems to something manageable.
The problem is that analysts always had to leaf through books searching for a design model that resembled the problem they were trying to solve. In practice, they would have to use a model that was sort of like their problem, that sort of handled their conditions and that sort of modeled the behaviors of their system. To make matters worse, most of these “canned designs” required huge numbers of runs. If a run costs a few cents and takes minutes, that's no problem, but if your experiment involves building or changing a multimillion-dollar semiconductor fabrication complex or shutting down a thousand-unit-per-minute assembly line, you cannot hope to do all the runs it would take to get meaningful results.
JMP takes DOE to a whole new level by providing unique, powerful custom design capabilities. Researchers can describe their problem precisely and fully, and JMP can determine smaller numbers of runs that will be sufficient. JMP's unique graphical factor profilers enable researchers to explore the result space over any combination of responses and factors and ultimately maximize desirabilities for their entire system in seconds. JMP's DOE has allowed blue-chip customers to discover million-dollar annual savings or profit opportunities in mere weeks. As Bradley Jones, Senior Manager of Statistical Development and chief architect of JMP's DOE capability, says, “Of all the statistical methods invented in the last 100 years, design of experiments is the most cost-beneficial.”
But JMP's unique power in areas, such as design of experiments and its newly introduced restricted maximum likelihood estimation of general linear models, are computationally intensive in the extreme. With JMP's new multithreaded architecture running on a 64-bit dual processor, experimental designs that once took several days to compute can now be calculated in minutes. And, problems that were impossible only last year can now be handled in minutes with 64-bit Linux JMP.
“When porting a 32-bit application to 64 bits, there are certain pitfalls you are likely to encounter”, says Potter. He continues:
The complexity is compounded if you support not only Linux but Windows and Macintosh as well, as we do with JMP. The key thing to remember is that in the 64-bit Linux architecture, pointers and longs are both 64-bits wide, while an int remains 32 bits. This breaks any code that assumes a pointer can be stored in an int.
If you have source code compiled on both Linux and Windows, you must be extra careful. Although it's perfectly legal to store a pointer in a long on 64-bit Linux, converting a pointer to a long won't work on Windows, where a long is still only 32-bits wide. On Windows any 64-bit pointers will have to be converted to long longs instead.
Until now floating-point operations on PowerPC for Macintosh used a 64-bit long double, but that may change in the future. PowerPC-based Macs use the “LP64” model in 64-bit executables, meaning that longs and pointers are 64-bit, just as they are on Linux. Apple has not yet announced a 64-bit strategy for Intel-based Macs.
Finally, although graphical user interface APIs are available to 64-bit applications on Linux and Windows, the Macintosh GUIs are not. Of course, you can separate your application into a 32-bit GUI that communicates with a 64-bit kernel, as Wolfram Research did with 64-bit Mathematica.
Nelson observed that porting JMP to 64 bits went smoothly. “The only issue was locating the few places where our code made assumptions about 32-bit word and pointer sizes”, says Nelson. “There were no surprises from the tools used for the port, either. Much of the ease in porting is due to the long heritage on 64-bit UNIX platforms of the open-source tools we used.”
“The GNU Compiler Collection, gdb, Emacs and the rest of the toolchain performed as expected on the x86_64 architecture”, says Nelson.
Besides JMP, the only statistical software available on the Linux desktop today is an open-source product called R. It has considerable analytical depth and its open-source nature allows statisticians who also have computer programming talent to extend R. However, for the vast majority of people working in statistics today, JMP is generally acknowledged to be a better choice. JMP has an intuitive graphical user interface, a broad range of deep analytical capabilities and comprehensive professionally written documentation. JMP customers have the confidence that their investment is backed by SAS's award-winning, PhD-staffed quality assurance, technical support and professional training and consulting services. SAS boasts a 30-year record of continuous growth, so JMP customers know they can count on SAS and JMP to be around for the long haul.
“People keep wondering if Linux will ever be a serious contender in the desktop market”, says Potter. “It's been disappointing to Linux enthusiasts that this hasn't yet happened. Now, with the availability of affordable 64-bit desktop machines, we might start to see that change”, Potter says. He continues:
From the server perspective, the Linux operating system is generally recognized to be more reliable and secure at a lower cost of ownership than the alternatives.
Many research scientists and engineers would have liked to adopt Linux on their desktops too. They have refrained from doing so, however, because the applications they depended upon and the computing power they needed simply weren't there. Now those obstacles are gone.
As more of the applications that researchers depend upon, like JMP, become available for 64-bit Linux, its share of the desktop market can only grow.
Erin Vang, International Program Manager for JMP R&D at SAS, built JMP's localization and internationalization program. Previously, she was documentation and localization manager for Abacus Concepts (StatView) and technical writer and quality assurance manager for SYSTAT. She holds a B.Mus. in music performance, music history and math from St. Olaf College and an M.Mus. in horn performance from Northwestern University.
