
Under-Ice Sonar Visualization
In World War II, the Arctic became an active theater of operations for German and Soviet subs, which occasionally ducked under the ice to escape detection. After the war, interest in cold-water acoustics led to work on sonar and navigation instruments that could be applied to submarines operating in the Arctic. As a result of the Cold War and the corresponding growth of naval concern about the possibilities of nuclear warfare in the Arctic, an under-ice capability for nearly all US submarines was implemented.
With the appearance of the first nuclear submarine, USS Nautilus, the Arctic Ocean beneath the pack ice finally could be explored fully and used for naval operations. Today, under-ice operations are standard for submarines of the US and other nations. Furthermore, studies suggest that sonar could be used as a tool for detecting and localizing under-ice oil spills. So, for both strategic and environmental reasons, the study of under-ice sound properties is important.
For more than two decades, the Naval Undersea Warfare Center, located in Newport, Rhode Island, has been investigating and modeling the under-ice sound environment. Current work involves the use of 3-D visualization to aid in the understanding of complex scattering that results from the impact of sound energy on the ice blocks making up an underwater pressure ridge. These pressure ridges, called ice sails above the water's surface and ice keels below the surface, are formed when floating Arctic ice collides (Figure 1).

Figure 1. Ice pressure ridges form ice sails above sea level and ice keels below.
Current 3-D visualization work builds on a previous effort that was designed conceptually to show submarine commanders target location volumes created by the rendering of data from towed submarine sound sensors. Subsequently, this software has been modified and greatly enhanced to display environmental information in all parts of the world, including under the Arctic ice pack. The enhanced 3-D display is capable of immersive stereopsis viewing in multiple environments, including fixed shore-based facilities, such as a 3-D CAVETM, or on mobile systems, such as a laptop using a head mounted display (HMD, Figure 2).
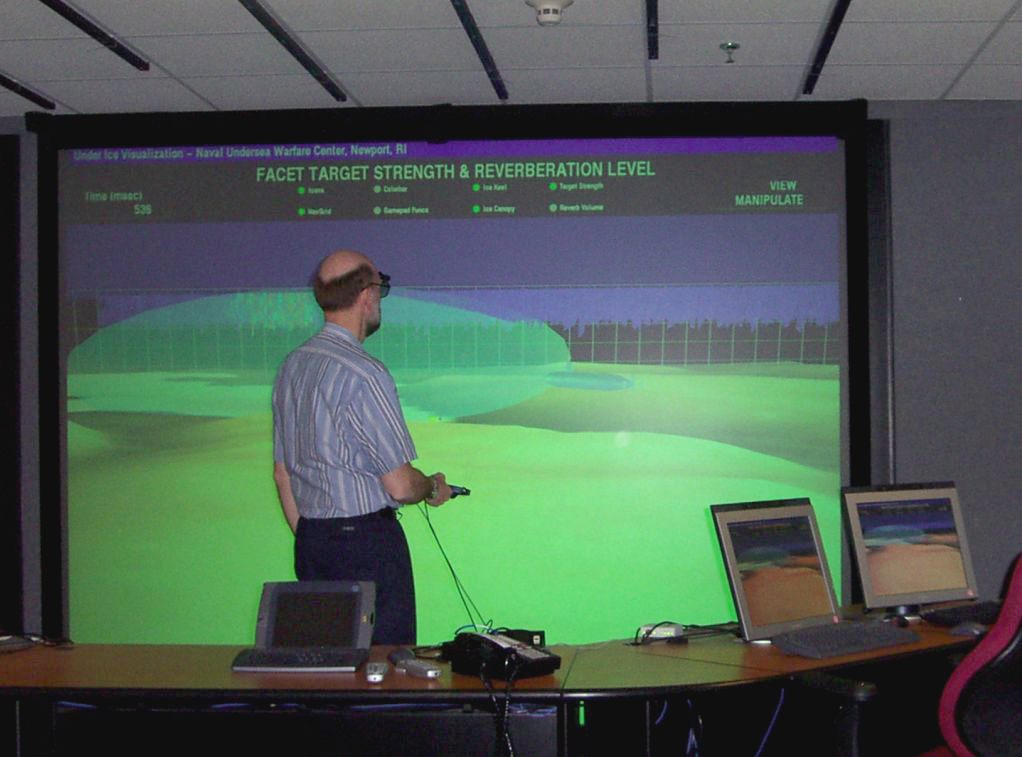
Figure 2. 3-D Visualization Work at the Naval Undersea Warfare Center
It is anticipated that through the use of these high-level graphics techniques that both rapid target identification, be it tactical or environmental, and data prospecting will allow for a better understanding of the complex sound behavior in areas of interest to the Navy.
Although the original software was written to run under the Silicon Graphics IRIX operating system, at the time of this writing, the new Undersea Environmental Visualization (UEV) version is compatible with and has been tested and developed under Red Hat Linux 7.0 through 9.0. Linux was chosen as the operating system for several reasons. First, it is compatible with current and future submarine combat systems. Second, it is a generic UNIX operating system, which means software and script files developed under Linux can be transferred readily to UNIX operating systems such as HP-UX and IRIX. Third, it is an open-source operating system with a large user community that can be tapped for system optimization and maintenance.
The UEV system is composed of two main modules, the bezel and the main 3-D display application. These two modules communicate with each other by way of TCP/IP sockets. Figure 3 illustrates this architecture.

Figure 3. Baseline Undersea Environmental Visualization Architecture
Separate modules were chosen for the display of the 2-D and 3-D data to allow separate viewing media to be used for each display, thus achieving the highest resolution for both. In its expanded form, the bezel also supports a 2-D overhead view. Still, this system is flexible enough to allow both displays to be shown simultaneously on a single screen, as shown in Figure 3. This simultaneous view does not support a 2-D overhead view, but it does support all the expanded version's functionality.
The bezel is a digital information and 3-D scene control program. The variables passed between the bezel and the main program include 3-D oceanographic/topographic maps, 3-D ice cover data, including ice keels, ice keel target strength data and 3-D sound propagation data, along with vehicle position data. The bezel for the UEV display was written using the XForms library. XForms is a GUI toolkit based on Xlib for the X Window System. It features a rich set of objects, such as buttons, scrollbars and menus, integrated into an easy and efficient object/event callback execution model that allows fast and easy construction of applications. In addition, the library is extensible and new objects easily can be created and added to it. Furthermore, Xforms was chosen for the prototype version of the UEV software because it is a stable and easy-to-use application programmers interface (API). In addition, absolutely no recoding is needed for operation under Linux.
Communication between the bezel and the main 3-D display happens by way of sockets that are established as datagrams in which messages sent over the network are self-contained packets delivered asynchronously between the two applications. This asynchronous form of communication was chosen because the data update rate between the two programs is slow enough that this primitive form of intra-program communication was sufficient. These links are primitive in their construction, requiring the specific IP address of the machines running the bezel and 3-D main application. Again, the reality, at least for research and development at Navy labs, is fast and inexpensive implementation is the driving force behind the creation of prototype software. This is so because software often doesn't advance past the prototype stage—the cost associated with programming elegance is a luxury.
However, a requirement for the follow-on UEV software is it must operate under Microsoft Windows as well as Linux. The Xlib version of XForms is no problem for Linux, but it is a big problem for Windows unless it is operated in the Cygwin environment. Although this is an option, the preference is for code that runs natively in both the Microsoft Visual C++ and Linux environments.
Our solution is the future conversion of the bezel to the Fast Light Tool Kit (FLTK), which will solve multiple problems. Because FLTK compiles under both Microsoft Visual C++ and Linux, the same software can be used for both systems. Second, the transfer of information between the bezel and main application can be converted from clunky TCP/IP sockets to a more elegant shared memory method. Finally, the bezel code can be brought into the 21st century by conversion of its XForms C routines to FLTK C++ methods. The conversion process currently is underway and is drawing in large part on the Open Inventor-based software that NUWC, Virginia Tech and the Naval Research Laboratory (NRL) jointly developed for the TALOSS Project. As the system evolves to rely more and more on 3-D interaction with the 3-D environment, the bezel controls will become less important and may disappear entirely. Most likely, they will be replaced by a virtual toolchest and a gestural-based interface.
The 3-D UEV display receives its mapping and navigational information from an under-ice canopy database that is loaded at startup and updated based on the evolution of the acoustic situation. The under-ice canopy database consists of an ice volume of uniform depth with one or more embedded ice keels. The area of acoustic coverage determines the extent of the ice canopy.
All under-ice acoustic information is pre-rendered as OpenGL Performer binary (pfb) files. Construction of the pfb files begins with using Matlab 7.0.1 on a Linux platform. Matlab is a flexible interactive tool for doing numerical computations with matrices and vectors but is capable of displaying this information graphically, in both 2-D and 3-D forms. Therefore, by using a combination of Matlab and C-based transformation code, the under-ice information that comes out of a FORTAN-based model, developed by G. Bishop, is messaged into a form that is compatible with the OpenGL Performer-based 3-D UEV display.
The transformation starts with a Matlab routine that calculates all polygonal surfaces and their normals. It then outputs this information to the C-coded routines that convert the information to pfb file format. The pfb conversion is a modification of the Silicon Graphics utility pfConvert that is available for both IRIX and Linux. The code snippets shown in Listing 1 were added into pfConvert.c to read in the polygonal information generated by the Matlab code. The pfConvert routine then uses its own libraries to output the data to a Performer pfb file. The 3-D main application combines all tactical, navigation and acoustic information into a comprehensive 3-D picture. It renders the picture using the computer platform-independent scenegraph, OpenGL Performer. The use of OpenGL Performer was necessitated by the need for an efficient and cost-effective means of displaying both planar and volumetric data within the same 3-D display. OpenGL Performer provided the least labor-intensive means of achieving this integration, although open-source freeware, such as OpenSceneGraph, could provide an inexpensive alternative to OpenGL Performer in future releases of the software.
Listing 1. pfb Conversion Code Snippets
Load Ice Keel Node and Store as pfb file

/**  read input file(s)           **/

      i = 0;
        group = pfNewGroup();
        for (i = 0; i < num_files - 1; i++)
        {

         printf("Make keel: %s\n",files[i]);
         bot_switch = (pfSwitch*)
                  LoadKeel(files[i],limits,i);
          pfAddChild(group, bot_switch);
          printf("adding switch to group\n");
        }
        node = (pfNode *)group;


    /**  optimize input file (optional)     **/
    node = optimize(node);

    /*
     *  write output file
     */
    pfdStoreFile(node, files[num_files - 1]);

    /*
     *  indicate success
     */
    return 0;
}

Convert Ice Keel to Performer Node

/***** LOAD AND CREATE A 3D SURFACE **********/
pfSwitch *LoadKeel( const char *file_name,
                    float *limits, long numfile  )
{
/* Declare Local Variables */
   pfSwitch *root;
   pfGroup *depth_group;
   pfGroup *mag_group;
   pfLOD *lod_ptr;
   pfDCS *dcs12;
   pfGeode *ice_geode;
   pfCoord    coord;
   long lod_cols;
   long lod_rows;
   pfMaterial *material;
   long i;
   long j;
   long status;

  /* Create work space to create surface */
     arena = pfGetSharedArena();

  /* Load vertices, normals and colors */
     status = load_data(file_name);
        if( status != OK )
         {
           exit (1);
         }

  /* Create the KEEL geode */
  ice_geode = MakeKeel();

  /* Create a group to hold all Depth and
   * Magnitude Features of Surface
   */
  depth_group = pfNewGroup();
  root = pfNewSwitch();

  /* Add ice geode to group */
   magflag = 0;
   pfAddChild( depth_group, ice_geode );
   dcs12 = pfNewDCS();
   coord.xyz[PF_X] = 0.0f;
   coord.xyz[PF_Y] = 0.0f;
   coord.xyz[PF_Z] = 0.0f;
   pfAddChild( dcs12,depth_group );
   pfAddChild( dcs12,mag_group );
   pfDCSScaleXYZ( dcs12, 1.0f,1.0f,1.0f);
   pfAddChild( root,dcs12 );
   pfDelete(dcs12);

   /* Return 3D Surface Switch */
   limits[0] = -1;
   limits[1] = 1;
   limits[2] = -1;
   limits[3] = 1;
   limits[4] = 0;
   limits[5] = 0;
   limits[6] = 0;
   limits[7] = 1;
   limits[8] = 1;
   limits[9] = 1;

   return(root);
}
Understanding the behavior produced by the scattering of sound energy in complex environments, such as under the Arctic Ocean pack ice, is an area of great interest to the US Navy and other navies. Insight into this complex acoustic environment is aided greatly by the simultaneous visualization of the in-water acoustic reverberation and the associated acoustic scattering from the ice keel.
Acoustic reverberation, which also could be called unwanted sound noise, simply is the re-echoing caused by sound bouncing off surfaces in all directions. In the case of the under-ice environment, these surfaces are the ice canopy and ice keels (Figure 4). Because sound energy bounces off objects three-dimensionally, it can be represented as a volume. This volume is referred to as the reverberant volume and can be represented in 3-D by individual volume elements, called voxels. Each voxel is color-coded to match the intensity level of the sound energy reaching it. Similarly, the intensity of the sound energy bouncing directly off the embedded ice blocks, called acoustic scattering, also is color-coded for intensity. The central idea behind the UEV software is to create an animated display that enables the user to interpret better the behavior of ice block scattering, as well as some of the space-time properties of the reverberant volume.

Figure 4. 3-D Sound Behavior
Individual nodes within the scenegraph represent the 3-D display of the information of interest, that is, the acoustic scattering from the surfaces of the ice blocks. Each block is formed as a six-faced polygonal surface, with each face colored to represent the target strength of the acoustic scattering from that face. To conserve memory and decrease rendering time, only those surfaces above a predetermined threshold are lit for any given acoustic scatter time interval. Turning the faces of the keel on or off is accomplished through the use of switches attached to each facial node. The reverberation associated with a given acoustic scatter interval is represented by a color-coded volume consisting of thin stacks of voxel volumes representing the reverberation for a given water depth. Again, these component reverberation volumes are addressed individually as nodes within the scenegraph. Figure 5 graphically illustrates the code snippets for the nodal structure of the ice facets and reverberation volume given in Listing 2. The advancement or regression of the acoustic scatter-reverberation display is controlled by the bezel. The display can be set to either continuous update mode or manual step mode. For any given time interval, the user can view any combination of ice block scattering and reverberation information, including blocks ensonified, lit within the entire ice keel; only the ice blocks of interest lit; the entire reverberation volume; or a user-selected depth slice of the reverberation volume.
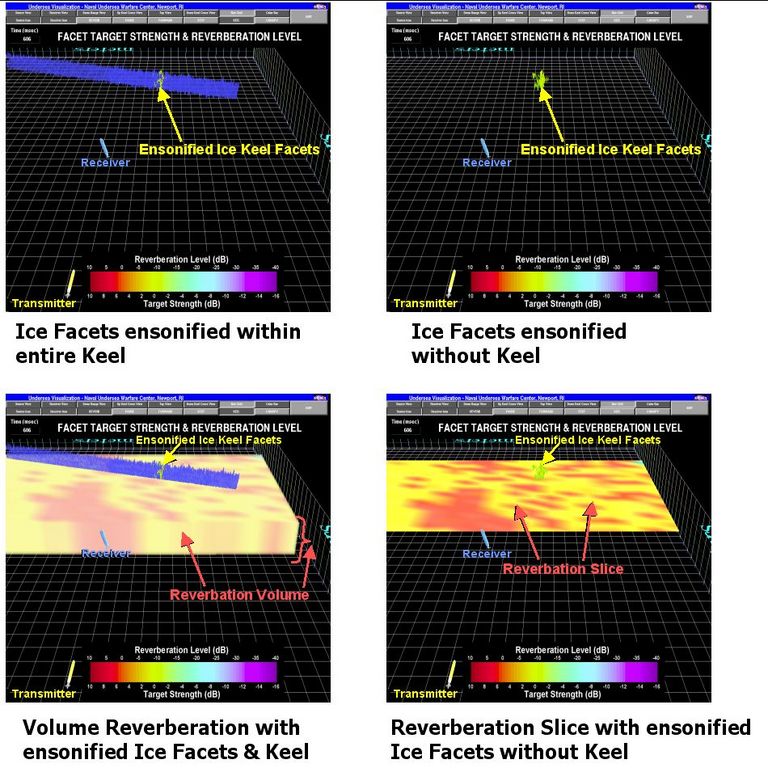
Figure 5. Graphic Illustration of Display Options Provided by Nodal Structure
Listing 2. Code Snippet—Nodal Structure of Ice Facets/Volume Reverberation
Adding Target Strength & Reverb Nodes

/* Target Strength & Reverberation MAKING ROUTINES */

/* Load the target strength reflected keels */
   nts = 0;  /* Number of keel target strengths */
   for (i = startpfb; i< stoppfb; i=i+5){

       sourcetime[nts] = i;

       /* Create load name for pfb file */
       sprintf(nts_name,"./PFB/out%d.pfb",i);

      /* Create Target Strength switch */
       ts_switch[nts]= pfNewSwitch();

      /* Load Target Strength pfb file */
       ts_group = pfdLoadFile(ts_name

      /* Create a coordinate node for
       * target strength */
       dcs6 = pfNewDCS();
       coord.xyz[PF_X] = -3300.0f;
       coord.xyz[PF_Y] = -650.0f;
       coord.xyz[PF_Z] = -125.0f;
       pfDCSCoord( dcs6, &coord );

       /* Add target strength node to
        * coordinate node */
       pfAddChild( dcs6, ts_group);

       /* Scale for good display */
       pfDCSScaleXYZ( dcs6, 0.201f,0.101f,0.2f);
       pfDCSScaleXYZ( dcs6, 5.0f,3.3f,15.0f);

       /* Add Target Strength in position node
        * to nodal switch */
       pfAddChild( ts_switch[ts], dcs6);

      /* Increment the Target Strength counter */
        nreflects = nreflects + 1;
    }


/* Load the reverberation field corresponding
 * to TSkeels */
   nreverbs = 0;
   for (i = startpfb; i< stoppfb; i=i+5){

       /* Create load name for pfb file */
       sprintf(reverb_name,"./REVERB/reverb%d.pfb",i);

       /* Create Reverberation switch */
       reverb_switch[nreverbs]= pfNewSwitch();

       /* Load Reverberation pfb file */
       reverb_group = pfdLoadFile(reverb_name);

   /* Stack the reverb planes to form a volume */
     for(j=150; j<190; j++)
     {
      /* Create a coordinate node for the reverb
       * plane */
       dcs6 = pfNewDCS();
       coord.xyz[PF_X] = -450.0f;
       coord.xyz[PF_Y] = 300.0f;
       coord.xyz[PF_Z] = j*-1.0f;
       pfDCSCoord( dcs6, &coord );

      /* Add target strength node to coordinate
       * node */
       pfAddChild( dcs6, reverb_group);

      /* Scale for good display */
       pfDCSScaleXYZ( dcs6, 3.5f,3.5f, 0.01f);
       pfDCSScaleXYZ( dcs6, 1.6f,4.3f,0.01f);

      /* Add Reverb plane node to nodal switch */
       pfAddChild( reverb_switch[nreverbs], dcs6);
     }

      /* Increment the Reverb counter */
      nreverbs = nreverbs + 1;
    }

/**** TS and Reverb SWITCHES ADDED TO SCENE ****/


 for (k = 0; k < nreflects; k++)
 {
                  pfAddChild(ViewState->sceneGroup,
                 reflect_switch[k]);
                  ++loaded;

         pfSwitchVal(reflect_switch[k],PFSWITCH_OFF);

 }

 for (k = 0; k < nreverbs; k++)
 {
                  pfAddChild(ViewState->sceneGroup,
                  reverb_switch[k]);
                  ++loaded;

         pfSwitchVal(reverb_switch[k],PFSWITCH_OFF);

 }
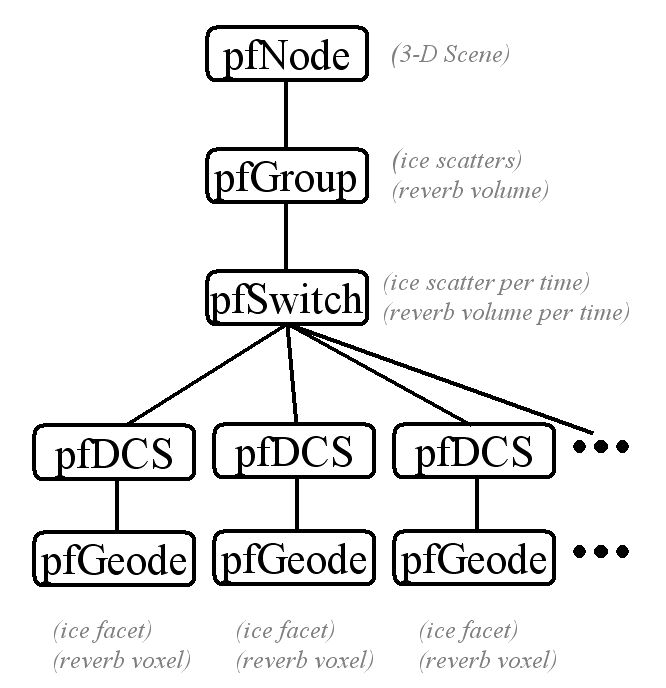
Figure 6. Sonar Visualization Scenegraph Structure
The 3-D scene navigation also allows the user to zoom in and manipulate a particular region of the acoustic environment of interest. This data mining allows for a better understanding of what processes are occurring in a particular region. Figure 7 illustrates a zoomed view of the target strength for the region of an ensonified ice keel. Notice that the scene can be manipulated by the user and viewed from several different angles. Figure 7 also illustrates the building of the reverberant volume for the same acoustic scatter interval, as well as the selection of a single reverberation slice for display.

Figure 7. 3-D Manipulation of Ensonified Ice Facets and Volume Reverberation
Finally, the user can observe the simultaneous evolution of both the target strengths of the faces of the blocks composing the ice keel and the accompanying water reverberation. Figure 8 illustrates the progression of the acoustic signal down a length of the ice keel and the accompanying reverberation at the receiver, in this case a submarine's acoustic system.
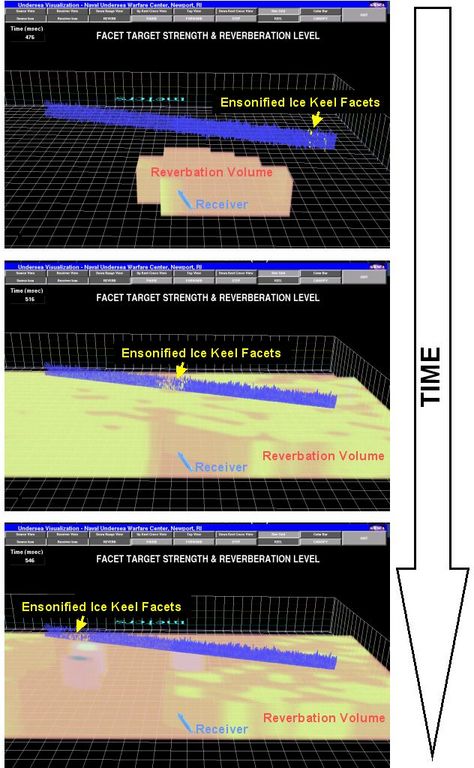
Figure 8. 3-D Progression of Sound Signal along the Ice Keel
The complexity of a data set such as ice keels lends itself perfectly to immersive visualization. The keel visualization environment displays sound energy in a volumetric form. Placing the user's viewpoint within that volume with a first-person perspective, rather than the current third-person perspective, should assist the observer.
Currently, the manipulation of the 3-D scene is dependent upon the standard keyboard and mouse. Planned upgrades to the under-ice visualization environment include a transition to an immersive display and 3-D gestural interface. The immersive display we have in mind is a head-mounted display. This design is portable and lends itself easily to use in tight quarters, such as those on a submarine.
When operating within a purely 3-D environment, the two-dimensional user interface becomes cumbersome. An elegant solution is to use a gestural interface in the form of a standard game pad with a sourceless inertial tracker attached. The object is to allow the user to position the viewpoint easily in any way. This functionality allows the user to better understand the complex visual representations of target strength and reverberation levels. Figure 9 demonstrates a prototype of the next step in the evolution of the UEV software.

Figure 9. Planned Gestrual-Based UEV Software
A flexible, modularized, 3-D data fusion visualization system to study and data-mine under-ice acoustic information has widespread applicability for both military and civilian use. Building upon work originally sponsored by the Office of Naval Research (ONR) and years of Arctic experience, the Naval Undersea Warfare Center is developing pioneering visualizations for the integrated understanding of the acoustic properties of complex ocean environments, such as those under the pack ice in the Arctic Ocean and in shallow water coastal regions throughout the world.
Because the Linux operating system is so adaptable and generic, it has been easy to transform the software originally written for Silicon Graphics machines to run now on Linux. Furthermore, because the US Navy operates in both the Linux and Microsoft Windows environments, Linux has provided a cost-effective means to update, compile and test the UEV software. We have found that if the software compiles under Linux without errors, it almost always compiles under Visual C++, as long as the laborious process of ensuring all the Microsoft Windows paths are set up properly. Linux provides a unique environment for rapid prototyping, which results in software compatible with both UNIX and Microsoft Windows operating systems, thus qualifying as a valuable fleet software expeditor.
Resources for this article: /article/8532.
Glossary of Terms
Acoustics: the physical properties of sound as they pertain to a particular situation.
Acoustic scattering time interval: the time interval in which a portion of the ice keel is being impacted by sound energy.
Data prospecting or data mining: the non-trivial extraction of implicit, previously unknown and potentially useful information from data.
Ensonification: impacting an object with sound energy.
Ice canopy: the ice cover formed by the ice pack.
Ice pack: a large expanse of floating ice.
Pack ice: ice making up the ice pack.
Sonar: the use of sound waves to detect underwater objects.
Stereopsis: 3-D vision, binocular vision and stereopsis mean the same thing.
Richard R. Shell is an electrical/computer engineer at the Naval Undersea Warfare Center Division, Newport, Rhode Island. He is a co-recipient of the NUWC 2003 Special Achievement Center Award for Technology Innovation for his work as part of the team that developed the TALOSS 3-D submarine undersea battlespace visualization software featured in the November 2003 issue of Linux Journal.
Garner C. Bishop received his BS in mathematics from Bates College in 1968 and his MS and PhD degrees in theoretical physics from the University of Connecticut in 1976 and 1982, respectively. In 1983, he began employment with the Naval Undersea Warfare Center, and from 1994 to 1996 he was a Visiting Lecturer in underwater acoustics at the University of Massachusetts, Dartmouth. He is a member of the Acoustic Society of America.
Douglas B. Maxwell is a mechanical engineer and research scientist at the NAVSEA Division Newport's Center for Advanced System Technology. His areas of expertise include design synthesis in virtual environments and synthetic training applications. He lives with his wife and dachshund in Newport, Rhode Island.
