
Custom System Statistics Monitoring
As a systems administrator, knowing the status of the systems in your network is a must. This can be quite a challenge when you are dealing with tens, hundreds or thousands of different systems. A multitude of options are available for obtaining systems statistics, many of them freely available. For my purposes, I had a number of different requirements that most packages did not meet. In the end, I opted to build my own. This article explains the design of my solution, as well as its installation and configuration for use in your own environment.
One of my first requirements for systems statistics monitoring was any solution has to include a SQL backend. At the very least, it needs to have some way to export its data easily to allow it to be loaded into a SQL database. I wanted all data to be stored in a set of tables, but for simplicity and speed I decided to store only a single set of current data in the primary data table. Historical data then would be archived to an archive table, allowing reporting tools to use much simpler queries to obtain either current or historical data and to increase the speed and efficiency of queries against the current data table.
I debated whether to use a central data collection system or to allow each client to collect its own data. In the end, I decided to have each client collect the data and update the database. This made it much simpler to do asynchronous status updates without using a threaded server using a pull model. The agent needs to run on each host to collect the data, so why not have it make the database updates too?
The data gathering was a much more difficult problem to tackle due to portability issues. After spending some time implementing data-gathering functions, I came upon libstatgrab, a cross-platform systems statistics gathering library written in C. Many of the statistics I needed were handled by libstatgrab, so the first version uses libstatgrab exclusively to collect the data.
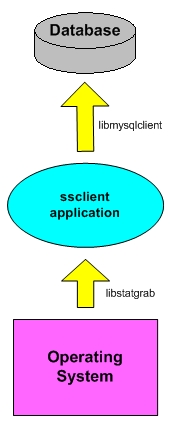
Figure 1 contains a simple graph showing the data flow from the OS level to ssclient via libstatgrab and then from ssclient to the database via libmysqlclient.
The ssclient client application uses the autoconf/automake/autoheader configuration method, so building and installing it should be a piece of cake for you. The current version is available here. Assuming the current version, download the tarball ssclient-0.2.2.tar.gz and run:
$ ./configure --prefix=/usr/local
The configure script attempts to locate your MySQL and libstatgrab installation locations and acts accordingly. If the configure script is unable to locate them, try listing their locations explicitly with:
      $ ./configure --prefix=/usr/local \
                --with-mysql-prefix=/path/to/mysql \
                --with-statgrab-prefix=/path/to/statgrab
Once configured, you should be able to run make and, as root, make install. If you do not have the MySQL and libstatgrab shared libraries installed on each of your target systems, you may want to consider linking against their static libraries, (libmysqlclient.a and libstatgrab.a. This allows you to distribute only the ssclient package to each system on which it will run.
A sample spec file for building an RPM for Linux systems, as well as pkginfo and postinstall files for building a Solaris package, is located in the misc/packaging subdirectory, if you would like to build packages for those platforms.
Assuming you used our example prefix of /usr/local, once completed you have an ssclient binary in the /usr/local/bin directory. Make a copy of the sample configuration file from misc/ssclient.conf and install it in the /usr/local/etc directory. Next, we dive into the shallow pool of the configuration file.
The ssclient is pretty simple to configure, requiring only a few configuration options. A sample configuration is listed below:
debug           0
interval        300
db_host         dbhost
db_database     ssdb
db_user         ssdbuser
db_pass         ssdbpwd
logfile         /var/log/ssclient.log
syslog          1
The debug setting sets the debug level for ssclient. For a production setup, you should set this this to 0. The interval setting is the number of seconds to sleep between each update. The default interval setting is 300 seconds. This setting actually is 300 seconds plus a random number of seconds between 30 and -30. This is done to vary the time that updates are made to the database. The db_host, db_database, db_user and db_pass settings are used for connecting to the database into which you want the records inserted. The logfile setting is the path to your logfile if syslog logging is disabled. The syslog setting enables or disables logging with syslog by setting it to a 1 or a 0, respectively.
Before ssclient can send its statistics to the database, a database and the proper database tables need to be set up. Both the database setup and user creation are facilitated by a setup script called setup_database.sh, located in the db subdirectory. The particulars of the database setup are documented in the file docs/README.db in the distribution tarball. Once completed, you should be ready to start running ssclient on your systems to populate the database tables.
In most cases, you want to run ssclient in its standard daemon operating mode. To tell ssclient to run as a daemon, you would invoke it with the -d flag, like this: [root@yoda /]# ssclient -d. ssclient initializes and then fork()s into the background, waking up when specified by the interval option to grab statistical data and update the database. That's the whole process.
A small shell script is available that can be run from cron to check that ssclient is running and start it up if it's not. A sample crontab entry for the check_ssclient.sh script is shown below. The check_ssclient.sh script can be found in the misc subdirectory.
# Check every 5 minutes to make sure that the ssclient is running
0-59/5 * * * * /bin/bash /usr/local/bin/check_ssclient.sh
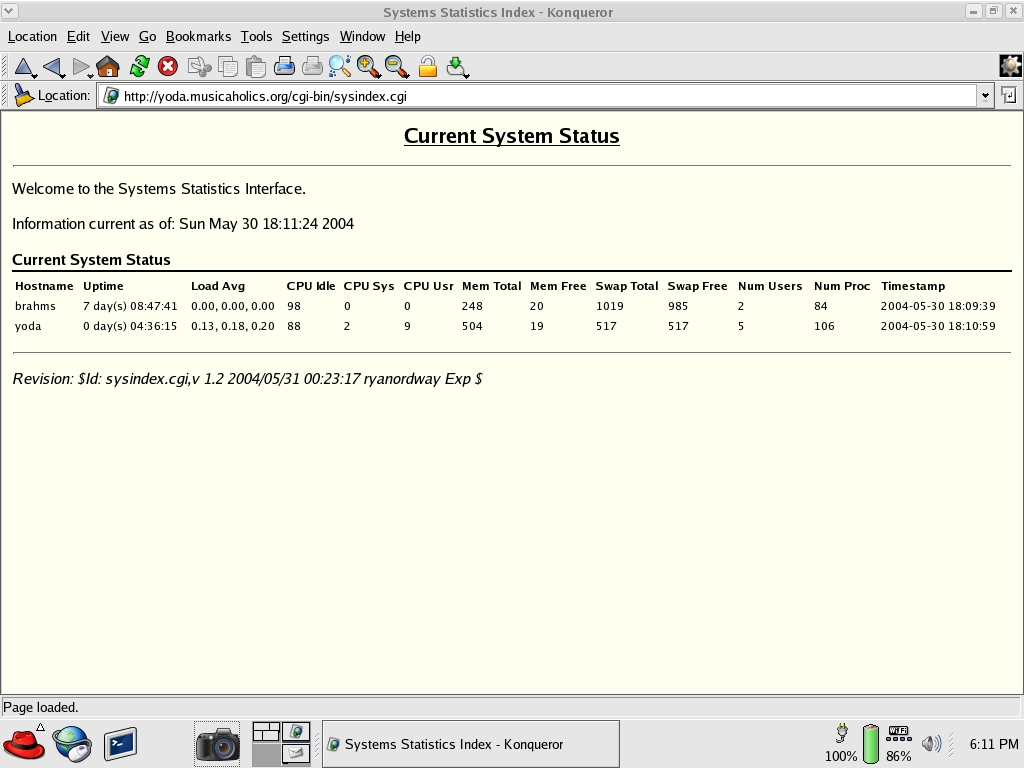
Extracting data from the database for reporting can be as easy as doing a SELECT on the current database table or as complex as merging the current data with historical data from the archive table. You even can use the numerical data points to generate graphs. A sample reporting interface is included with the main distribution in the examples/web directory. The sysindex.cgi program is a Perl CGI application that uses DBI to talk with MySQL, grab all rows from the current data table and output them in a simple HTML table, as shown in Figure 2.
Monitoring the performance of systems in your network can be quite a chore without the proper tools. Each administrator has their own monitoring needs. When existing tools don't fit, roll your own. The ssclient should serve as a good starting point.

