
Network Management with Nagios
When I started with the John Deere Agricultural Marketing Center, we had 12 sites around the US and Canada. These locations had a mixture of equipment, older servers and desktops providing all functions from domain services to printing. That presented a problem to us functioning as a centralized IT organization. How could we manage and monitor the servers and WAN lines in these diverse sites?
About two years ago, we decided to move the user data from the center of our network out to the edges. But how could we monitor all the equipment from multiple manufacturers across all the sites? To give you an idea of the equipment we were monitoring, each of our main sites had a Maxtor 4100 network-attached storage (NAS) server along with a Compaq 1600 serving as a print server and domain controller. Some of the small sites had Dell GX1 desktops serving as local print servers. At our main site, a Compaq TaskSmart N2400 was our main file server.
Because of this diverse setup, no manufacturer's management toolset served our needs, and the idea of using multiple tools to monitor everything was not something I wanted to do. So, we had to choose among manufacturer-neutral monitoring tools. What we found seemed to be grouped into three different tiers. At the low end was a solution that did not expand well to monitor a growing number of servers and hosts. For the most part, we would be stuck with the tools that came with the program. Other tools were what I call top-of-the-line products, such as Hewlett-Packard's OpenView. It would expand and grow with what we needed and monitor what we wanted, but it had a price tag well out of our range.
As we started to lose faith that anything existed to fit our situation, I ran across a project called NetSaint. NetSaint was a monitoring system that would grow with our needs and allow us to monitor what we wanted with an open framework allowing us to write our own plugins. Not only would NetSaint monitor servers and services, it enabled us to make our jobs more proactive instead of reactive by following the trends it showed us.
Everything went along fine, with NetSaint performing its job reliably in one of the smaller units of John Deere. As time went on, the Agricultural Division started an IT divisionalization project, with the goal being the ability to leverage areas of expertise all across the division.
With this new project, the old problem of monitoring resurfaced. As we tried to move to a more centralized IT structure, we needed to perform everything the other monitoring programs did. Also, every unit was on its own to make IT decisions to fit its needs. So the question was: How would we take the multiple monitoring solutions in use and move toward one standard solution? This solution would need be able to handle the possibility of monitoring hundreds of hosts with thousands of services, while allowing individual units to extract data into graphs to monitor trends. Also problematic was an even more diverse set of equipment to monitor, from Network Appliance to Sun to Dell.
We still had the financial constraint, which meant the OpenView class of products was out of our range. Because we were running NetSaint in a production environment, we decided to go ahead and start looking into a NetSaint solution for the Ag Division. The first thing I learned was if you stop following the Open Source community for a while, a lot will have changed when you come back. In this case, NetSaint was no more; its descendant is Nagios (www.nagios.org). For the most part, Nagios is the next step in the NetSaint evolution. I confess to some sadness seeing the penguin removed from the main page, but I got used to it and moved on.
Studying the system, we decided to use a multi-tier model, with Nagios servers at each unit that came onboard with the monitoring project. This was mainly to ensure that no one server would be overloaded, allowing us to maintain the level of monitoring we needed. With this in mind, we installed the parent server at our headquarters in Moline, Illinois, with the first child server in our Ag Marketing location in Lenexa, Kansas.
The install of Nagios was the same for both the parent server and the child server. We loaded Red Hat 8 on both and then installed Nagios. The documentation that comes with the system is fairly complete and walks you through the install process easily. Along with Nagios, we installed a program called Nagat on each of the servers (Figure 1). Nagat is a web-based configuration tool for Nagios. With this install, the system allows you to fill in the blanks on the web page and generates the configuration files based on your answers. Therefore, less-experienced people can configure Nagios, its services and hosts without touching a terminal window.
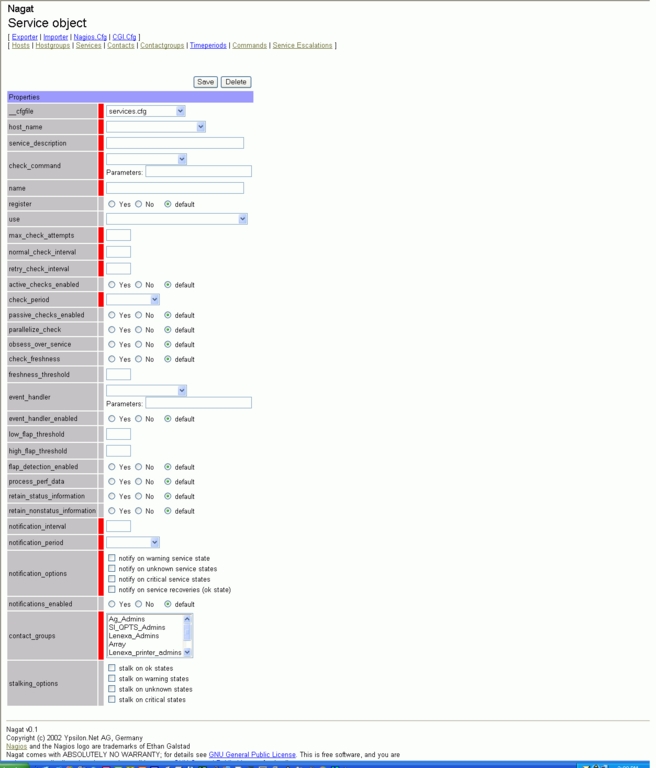
Figure 1. The Nagat Services Page
Because we used Nagat, we ran into some difficulties with our Red Hat 8 install. To fix the compatibility problems, we had to install earlier versions of PHP (4.1.2) and Apache (1.3). With this resolved, we were able to get the systems up and running quite quickly. Nagat had a few bugs that were easy to work out, one occurring on the service edit page: the system does not save the contact group. To fix this, all you have to do is add the following lines after the case statement on line 39:
$saveobject['contact_groups'] =
    @implode("'",$saveobject['contact_groups']);
By doing this, you will be able to save changes to your contact groups when you update your services.
Once everything was installed, we came to what I would call the hardest part of the whole project—the configuration of the servers. It wasn't so much configuring the server as it was figuring out what we wanted our system to do and the path to take to get it done. One of the first decisions we made—one we now are reversing—was to compile Nagios without native database support. It met our needs for over a year, but as we bring more units onto the Nagios monitoring platform, mining the data provided from Nagios is becoming more of a priority. No longer are the simple graphs that come with Nagios enough. We want to take the data and trend it out in as many ways as there are units and people, which was not all that easy to do with the flat text files we had with our original Nagios install.
The next step was the main configuration, which for the most part is really straightforward. There are a few things you need to look into and explore a little to get the most out of the Nagios system. One of them is the idea of smart checks. Instead of the system running all of your service checks at the same time, causing high CPU utilization, Nagios spreads out the checks over, say, five minutes, causing lower CPU utilization. Another thing to look at is the parallelized service checks; they allow you to run more than one service check at a time, which really helps on systems with multiple CPUs.
The configurations of the parent and child servers are almost identical, with two important differences. The child server has notification turned off and the active checks turned on by default, and the parent server has the exact opposite. This is done to lower the load on the parent server and to have all notifications sent out from only one computer. [The configuration files for both servers are available at ftp.linuxjournal.com/pub/lj/listings/issue111/6767.tgz.]
From there, the next step is defining the commands Nagios should perform. This is one thing I stress to the people using this system: Nagios is a framework. What I mean is, Nagios itself does not perform any checks; that work is left to the plugins that Nagios can call. This is good because it allows you to write your own plugins easily, as long as you stick to the framework Nagios provides. As a result of the plugins we have written, we have the ability to monitor systems that were not originally in the Nagios plugin distribution. For example, we now are able to monitor NetApp filers, to pull the page counts from our HP printers and to integrate Compaq Insight Manager data into the Nagios system.
The easy way to monitor a Microsoft Windows server, but not the only way, is to use NSClient. NSClient is a program loaded on your Windows boxes, and it runs as a service. To run it, open up a port on the Windows server. For security, you can use a password to access the port. At the time of this writing, no encryption is built in to the program for talking to the Nagios server. The plugin allows you to poll the server for memory utilization, disk utilization, processor load and most other information that can be polled using the performance manager tool with Windows.
A slightly different method is used to monitor your Linux and UNIX systems. Run a program called Nagios Service Check Acceptor (NSCA), either in dæmon mode or under inetd. With this program, Nagios starts a plugin called check_nsca, which opens an encrypted session between the two computers and runs the plugin to check the other computer. The configuration of the system is rather straightforward; pick an encryption standard between the two servers and define the plugin command on the client. Once this is done, you can start pulling the data back into Nagios.
As I said earlier, we are now in the process of moving from the flat files that are the default for Nagios to a back-end database. We plan to use that data to provide better data trending through the use of tools such as Crystal Reports. Nagios provides native support for two databases, MySQL and PostgreSQL. Scripts are provided with the Nagios files for setting up the database and preparing all the fields and tables for Nagios. We decided to use PostgreSQL. Once the database is all set up, you need to rerun the configuration script with --with-mysql-xdata or --with-pgsql-xdata. xdata sets up the system to use the database for everything. As of right now, the only pieces that do not support the database are the configuration files.
That last statement brings up an interesting point: an add-on came out in March 2003, a Webmin plugin for Nagios (Figure 2), called NagMIN. Not only does it allow web-based configuration of Nagios, like Nagat, it offers a few things that nothing else has offered so far. First, it offers database support of the Nagios configuration files. Second, something quite useful if you are starting to set up your Nagios install, is the port scan feature (Figure 3). I have not tried out this feature fully yet, but it claims to perform a network discovery and turn what it finds into Nagios configuration files, saving you the trouble of having to enter all the data yourself. NagMIN should work with most systems, but the more-specialized monitoring most likely still has to be entered into the system by hand. If you would like more information about this plugin, go to the SourceForge.net web page.
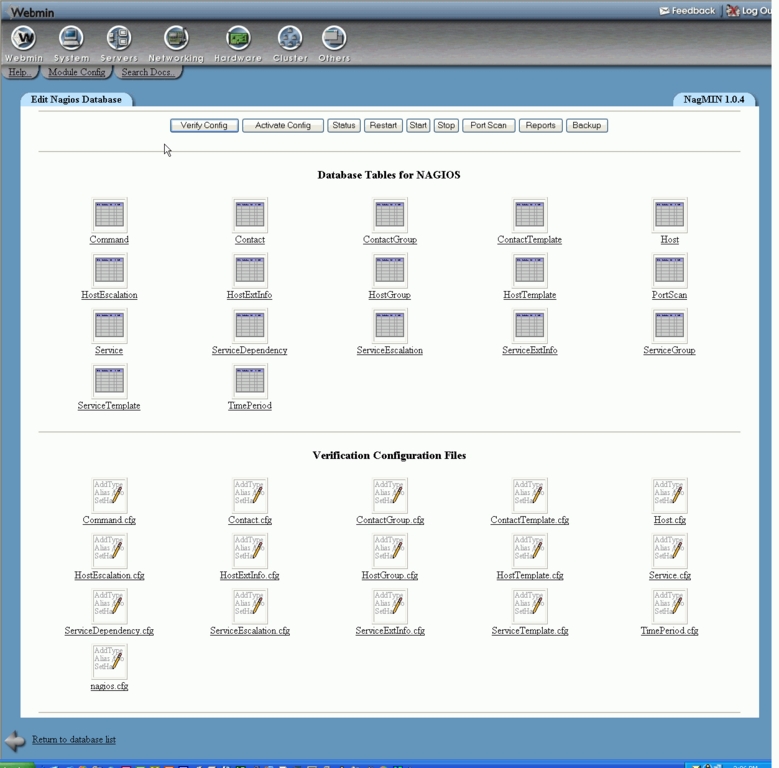
Figure 2. NagMIN Main Page
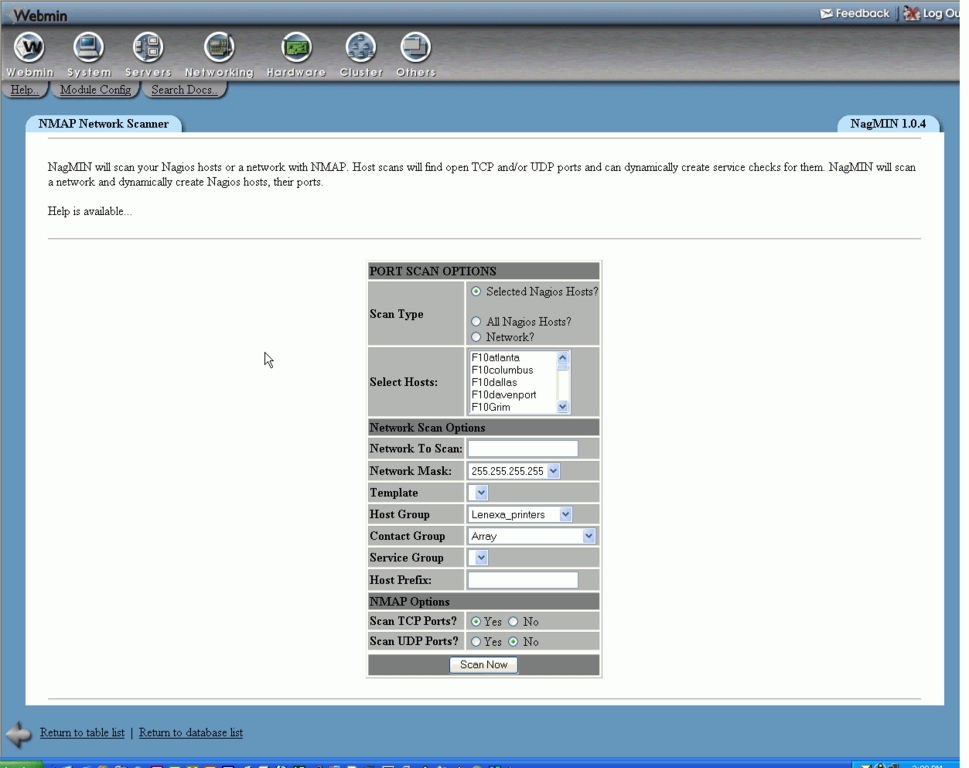
Figure 3. A NagMIN port scan discovers services to monitor.
We set up our Nagios server in a parent/child relationship. To do this, the system needs to be set up a little differently from what it would be for a standalone system. For one thing, we installed only the web interface on the parent server (Figures 4 and 5). All the child servers do is funnel their check results to the parent server using passive checks. To make this work, we defined an OCSP command to run a script to submit the data to the parent Nagios server. By using the OCSP command to run the script, it is made to execute after every check that Nagios runs. Because of this, for the most part, only the child servers need to run active checks. This allows the Nagios parent server to run only the web interface and to send out notifications in case of problems.
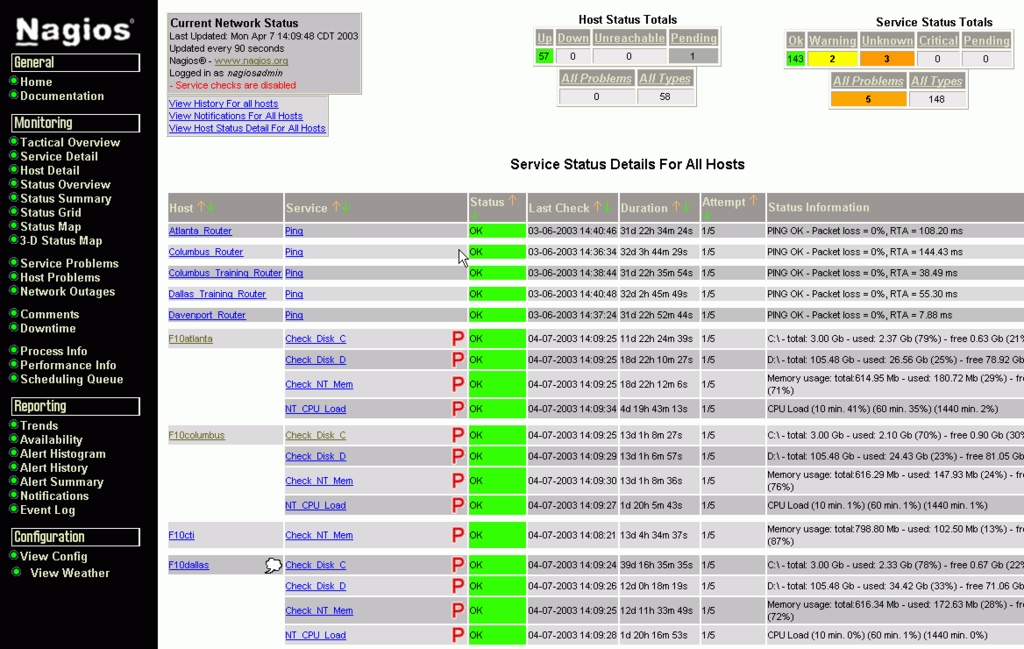
Figure 4. Nagios Service Detail
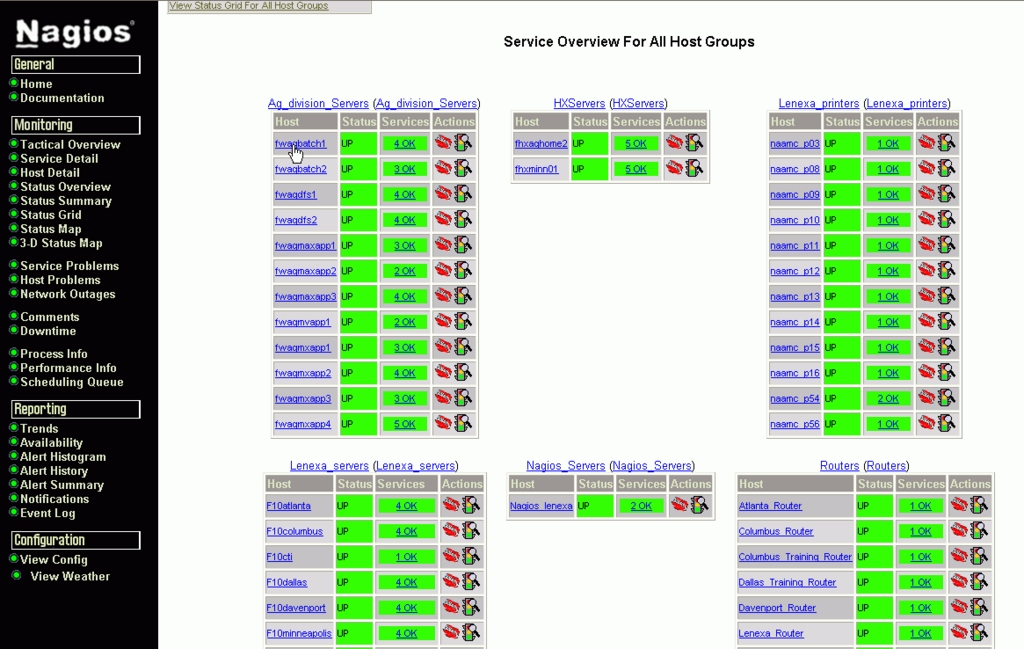
Figure 5. Status Summary
Now that you have an idea of how we set up Nagios, let me tell you about something it has done for us. Around the first of this year we purchased a digital thermometer, called TempTrax, that works with Nagios. We use it to take temperature readings of our main computer room. Around the first of March, we learned how important Nagios is to us. I received a page at about 12AM on a Friday telling me there was a warning on the computer room temperature. In the time it took me to get dressed, the system started sending out critical pages about the computer room temperature. By the time I got to work, the temperature was above 80° and rising. Because of Nagios, I had enough time to make an emergency call to our air-conditioning people and have the unit repaired before any serious damage was done to the computers. We found out later that two other systems monitoring the computer room A/C unit had failed to dial out and alert the people watching the system. If Nagios had not alerted us to the problem in the computer room, I would have walked into a much bigger problem that next morning.
Overall, I would have to say that Nagios is an excellent network monitoring product. As described, it is a framework, and by itself it can't do much—but that is what makes it such a good product. Because it is a framework, it does only what you want it do. Being an open framework, designing new plugins with Nagios is as simple as formatting the output from your check into the format that Nagios expects. With this your plugin is able to use everything Nagios has to offer, which is quite a lot. In the end, Nagios is something you should at least take a look at, if not test install at your own location. I do not think you will be disappointed.

Richard C. Harlan is a network engineer at the John Deere Ag Marketing Center in Lenexa, Kansas. You can reach him at harlanrichardc@johndeere.com.

