
Health Monitoring with lm_sensors
A few years ago, a friend of mine had problems with his computer. It became unreliable; he would get odd errors, or the system would hang. He re-installed the operating system and his key applications, but the problems persisted. This cost him time, and his time is valuable.
The problem turned out to be simple: the cooling fan on his CPU's heat sink was dead. The overheating CPU, in turn, caused random problems. He wound up replacing the CPU as well as the heat sink, because the CPU had been damaged.
He could have avoided all of this if he had been running some sort of computer health monitoring system, such as lm_sensors.
lm_sensors is a set of Linux kernel modules for monitoring the vital signs of a computer: the voltages from the power supply, the temperature of the system and the CPU and fan speeds. lm_sensors includes a command-line utility for checking the current readings. A variety of graphical tools also are available for putting a pretty face on lm_sensors.
Before you attempt to install the lm_sensors kernel module, you should have the I2C driver modules installed. I2C, which stands for Inter-IC bus, is a simple serial data system for connecting chips so they can talk to one another. Most motherboards with health monitoring features use an I2C bus to access those features.
Make sure the I2C drivers are installed on your system. (If you build your own kernel, the I2C options are located under Character Devices.)
Install the packages that provide lm_sensors, or build it from source code and install. Then enter sensors-detect, a script that figures out how to install lm_sensors on your system. It will try various I2C modules and then try various lm_sensors modules, until it finds a combination that works on your system. When it is done, it provides instructions for how to set up configuration files in /etc, which load the correct modules when your system boots.
Once the modules for lm_sensors are installed and working, you can run the sensors command from a shell and receive some useful output. But you probably aren't done yet.
Your next step is to edit the /etc/sensors.conf file. This file sets some custom parameters that make lm_sensors work with your computer system. For example, you can add a label that changes Temp1 to CPU Temp; you can disable Temp3 completely if you don't have a sensor and it is reporting nonsense; and you can customize the math functions used to calculate the displayed values.
Ideally, before you edit /etc/sensors.conf, you should reboot your computer and enter the BIOS setup screens. (For most computers, you hit the Del key or the F1 key during bootup to enter the BIOS. Check the owner's manual for your system, or watch the screen during bootup for a message like Hit <Del> to enter Setup.) The BIOS setup should have a sub-menu showing the same numbers you would like lm_sensors to report. Make a note of the readings you are seeing. For example, if the CPU temperature is about 60 degrees Celsius, write that down.
Now, booted back into Linux, run the sensors command. If the numbers are all there and look correct, you are done. If not, you need to customize /etc/sensors.conf.

Sample sensors Output
Take a look at the top of the output of the sensors command; it shows you with which chip lm_sensors is communicating. Find that chip in /etc/sensors.conf and look at the settings you can customize. /etc/sensors.conf is liberally commented, making it easier to figure out what you need to do. You also can read the man page, man sensors.conf.
Once you have customized /etc/sensors.conf, you must run the command sensors -s to put your changes into effect. Then run the sensors command once again to inspect the values it reports.
Additionally, you should make sure sensors -s runs each time your system boots.
You have the option to install sensord, the lm_sensors monitoring dæmon. You can configure this to log either to standard log files or to a round-robin database (a constant-size database set up to hold, for example, a week's worth of readings; new readings overwrite the oldest). By editing /etc/syslog.conf, you can arrange to receive e-mail when sensor readings go out of bounds.
lm_sensors creates files under /proc with sensor values in them. You can create a custom monitoring system by writing scripts that check the values from these files or parse the results of the sensors command.
The source distribution for lm_sensors includes a simple Bourne shell dæmon, healthd.sh, that sends e-mail to the root account if any sensors indicate an alarm state.
A bunch of programs are available that check lm_sensors values or display them in some cool-looking fashion, including applets for KDE and GNOME and several window managers. The resources section has some links to get you started.
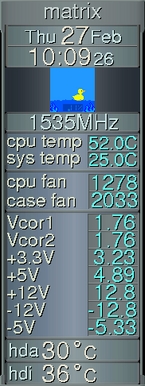
I've been running the elaborate GKrellM, a GTK applet designed to make an impressive panel of monitors. The screenshot to the right shows it running on my system, with not only lm_sensors data but also with S.M.A.R.T. hard disk temperature data and the BubbleFishyMon plugin. (BubbleFishyMon represents memory load as the water level, CPU activity as bubbles and network packets as fish swimming back and forth. The rubber duck is just for fun.)
It takes a bit of work to get lm_sensors working on your system, but it's well worth it. You might catch a hardware malfunction early, before it becomes serious. Even if you don't have any problems, it's reassuring to be able to check up on the health of your system quickly.
lm_sensors Related Projects at Freshmeat.net
GKrellM, the System Monitor from the Forbidden Planet
BubbleFishyMon, a Plugin for GKrellM
hddtemp, a Plugin that Monitors Hard Disk Temperature Using S.M.A.R.T.
xsensors, a Simple lm_sensors Display that Uses GTK widgets
Steve Hastings first used UNIX on actual paper teletypes. He enjoys bicycling, music, petting his cat and making his Linux computers do new things.
email: srhastings@langri.com
