
Embedded Real-Time Linux for Instrument Control and Data Logging
When I moved to the West Coast to take a job at NASA's Ames Research Center in Mountain View, California, I was impressed with the variety of equipment and software that scientists at the center use to conduct their research. I was happy to find that I was just as likely to see a machine running Linux as one running Windows in the offices and laboratories of NASA Ames (although many people seem to use Macs around here). I was especially happy to find that the particular group with whom I was going to work, the Atmospheric Physics Branch at Ames, relied almost entirely on Linux machines for their day-to-day work. So it was no surprise that when it was time to construct a new control system for one of their most important pieces of hardware, a switch from an unpredictable DOS-based platform to an embedded Linux-based one was a decision easily made.
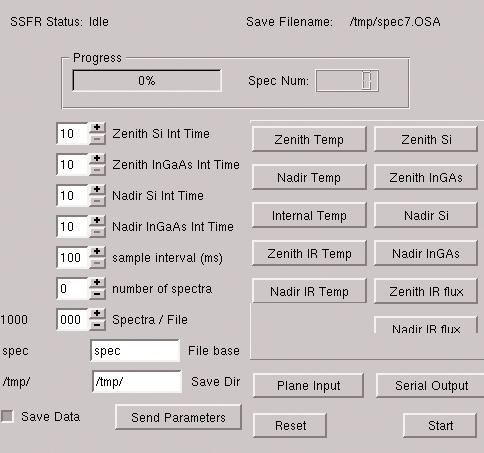
The Main GUI Screen of the System Aboard the Aircraft
The system I am working on is called the Solar Spectral Flux Radiometer (SSFR), a PC/104-based system custom-built by Warren Gore at Ames. Gore, Dr. Peter Pilewskie, Dr. Maura Rabbette and Larry Pezzolo use the SSFR in their research. The team working on the controller project consists of Gore, John Pommier and myself. The SSFR is used by the Ames Atmospheric Radiation Group to measure solar spectral irradiance at moderate resolution to determine the radiative effect of clouds, aerosols and gases on climate, and also to infer the physical properties of aerosols and clouds. Two identical SSFRs have been built and deployed successfully in three field missions: 1) the Department of Energy Atmospheric Radiation Measurement (ARM) Enhanced Shortwave Experiment (ARESE) II in February/March, 2000; 2) the Puerto Rico Dust Experiment (PRIDE) in July, 2000; and 3) the South African Regional Science Initiative (SAFARI) in August/September, 2000. Additionally, the SSFR was used to acquire water vapor spectra using the Ames 25-meter base-path multiple-reflection absorption cell in a laboratory experiment.
The SSFR is designed to be deployed in aircraft such as the General Atomics Altus Uninhabited Aerial Vehicle and the ER-2 (NASA's version of the U-2). The SSFR box is mounted somewhere in the aircraft, connected by optical fiber to two light collectors mounted on the top and bottom of the plane. The heart of the SSFR is a midtower PC-sized box whose innards are dominated by spectrometer interface electronics and hardware. In one corner sits the PC/104 stack that controls the instrument's operation. The stack is based on a CoreModule P5e card from Ampro, which provides a 266MHz Pentium processor and 32MB of RAM (in our configuration). Other cards in the stack provide the serial interfaces that we need, as well as standard interfaces to a keyboard, mouse, Ethernet, video, etc., which are used in development. Considering the harsh temperature and vibratory conditions under which the system must be completely reliable, having moving parts in the system could not even be considered. With this in mind, the system contains a 40MB M-Systems disk-on-chip and a PCMCIA interface, in which we can hot swap Flash memory cards to store data on. The stack also contains a timer card, with an interface to an IRIG-B timecode generator, and a battery ackup and power monitoring card, which is essential when dealing with unreliable power coming off of the plane. In addition, the box contains an internal thermostat, heater and cooling fan (I admit it, there is one moving part) in order to try to keep the temperature in the box at acceptable levels for the spectrometer hardware to function. Each of the spectrometers also contain thermal monitoring and control circuitry.
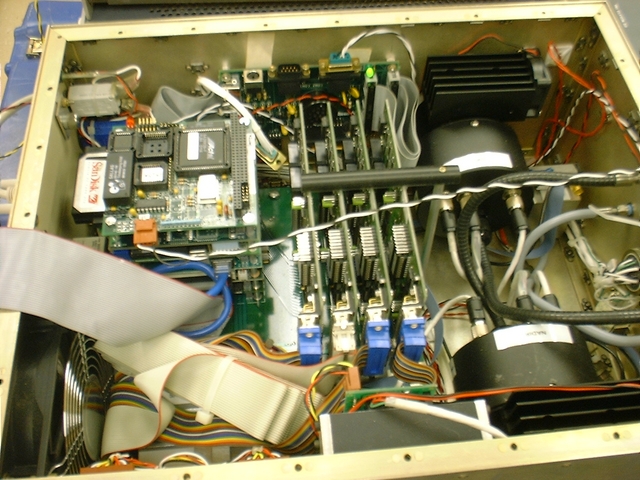
The inside of the instrument. As you can see, it is dominated by the interface cards for the spectrometers (middle) and the instruments themselves on the right. The PC/104 stack is shown in the upper left.
The SSFR box can be either left headless, in which case it samples autonomously, or it can be connected to a large blue box that contains a small ATM-style flat-panel display and a keyboard, as well as power converter for data validation and debugging of the SSFR ``on the runway''.
During normal operation, the SSFR controls the electronic equivalent of opening and closing the shutter in two sets of Si and InGaAs diode array-based spectrometers, one set taking readings from above the plane and one set taking readings from below. It must do this at precise intervals and keep each of the instruments collecting light for a precise amount of time (the integration time) before it samples the data from each. Data from each of the spectrometers comes in as a set of 256 32-bit numbers, each representing the amount of collected radiation at a particular wavelength. The SSFR also reads in the temperature inside the box and at each spectrometer at the time it reads the spectrum. In addition, the SSFR is expected to accept data asynchronously over an RS-232 port that contains navigational and attitude data from the airplane. This data needs to be matched precisely in time to data coming in from the spectrometers in order that the exact patch of sky and exact viewing direction of the spectrometers is known during data analysis. Because of this, accurate timestamping of absolutely every bit of data coming in is essential.
As if this wasn't enough to think about, it also was desired that the system should both be able to run autonomously as well as to be controlled and monitored with either a text or graphical user interface if so desired. This enables us either to stick the box in a plane and forget about it or have a human up in the plane operating the device and doing rudimentary data verification and analysis in real time.
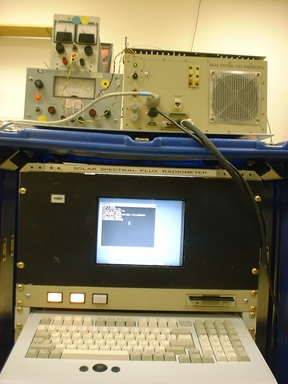
The on-the-runway setup. The SSFR box is connected to an ATM-style monitor and pull-out keyboard to do calibration and data analysis in the field.
After evaluating a few options, we decided to go with a system based on FSMLabs' RTLinux (http://www.fsmlabs.com/). We figured that this would enable us to guarantee the hard real-time performance that is essential for the system, as well as let us build upon a normal Linux system for anything that does not have to be real time, without worrying about compromise of the machine's essential data-gathering function. I also thought that the idea behind RTLinux was rather clever, which was clearly a feather in its cap.
The software architecture of the system is based on the RTLinux kernel/user-space separation approach, where the operations that need to be run in real time are contained within a kernel module that, when inserted, takes over the operation of the machine, only letting the Linux kernel proper run as an idle process. You then can use either FIFOs or shared memory to connect this real-time portion of the system to parts that do not have to run in real time, such as the user interface and the part that actually writes the data to a storage device. We chose to use FIFOs because of the nature of the device as a sort of data streamer, as well as their relative ease of implementation.
Installing RTLinux on the disk-on-chip with all of the hardware support and software that we needed turned out to be a relatively painless process. The disk-on-chip gave us 40MB of storage, which is really quite a lot of space to put a system on. We downloaded the disk-on-chip (DOC) drivers from the manufacturer's web site (http://www.m-sys.com/), which provide everything you need to boot a minimal Linux system from the DOC. We started with a 2.2.19 kernel and a Red Hat 6.1 system on a hard drive connected to a standard IDE interface. The DOC was shipped with a DOS system on it but was configured as the second BIOS drive, which enabled us to boot Linux from a hard drive (which is seen as the first drive if attached) and get to the DOC, which was very convenient. We then applied both the DOC and FSMLabs patches to the kernel, threw in a recent copy of the pcmcia-cs package (http://pcmcia-cs.sourceforge.net/) and compiled. It was important to keep in mind here that we didn't need to compile into the kernel anything to interface with other hardware like the spectrometer hardware, timecode generator interface or power control module. Since the operation of these things is integral and critical for the basic real-time operation of the device, these are dealt with directly in the real-time module. Only things that are used outside of this, in our case the PCMCIA drivers used for the user-space writing out of the data, need support compiled into the kernel in the usual way.
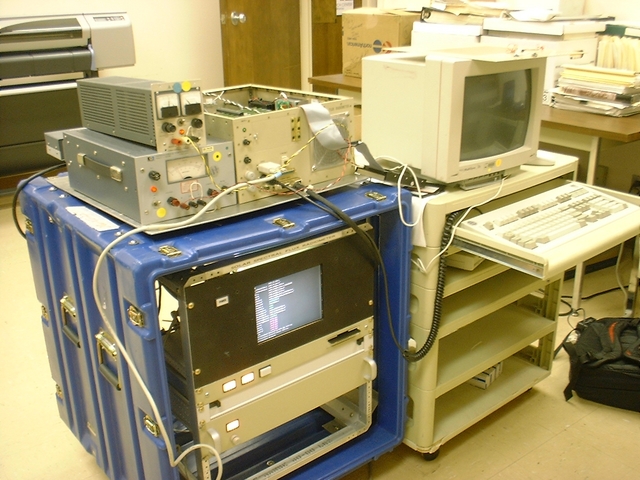
The development setup: the external monitor, keyboard and hard disk drive are connected during development of the spectrometer software. The two gray boxes are just 12V and 5V power supplies for the external hard drive used only in development.
We then used the DOC standard utilities (only in DOS--now where was that old Win95 boot disk again?) to low-level format the disk and make the BIOS think that it's the first drive. We then used the usual Linux fdisk and mke2fs to get the DOC ready for a Linux system. Within the DOC drivers provided by the manufacturer, there is a file list and a copy script for a bare-bones Linux system based on a standard Red Hat 6.2 install with some standard utilities, shared libraries and device entries. We took out some of the shared libraries that we knew we wouldn't need, took out many of the device entries and replaced a lot of the programs in the list with links to BusyBox (http://busybox.net/). We also added the scripts and modules required by RTLinux. This gave us a fairly minimal but very functional system, leaving as much room as possible for any data analysis programs that we might want to install in the future. Using the custom LILO included with the DOC software got us booting off of the DOC with minor difficulty, as we ended up needing to modify the lilo.conf file to specify the BIOS disk number manually, as in
disk=/dev/msys/fla
        bios=0x80
We also could not acknowledge the possible existence of an IDE hard drive when installing LILO on the DOC; something I do not fully understand but have learned, over time, to accept.
From here we began to port the drivers for the spectrometer hardware (written for MS Visual C) over to kernel code. I thought that this was going to be very painful, but it turned out to be not so bad. The most significant difficulty in doing this stemmed from the fact that the original drivers were written by German programmers, and most of the variable names and comments in the original software tended to confuse things for us. We referred to these difficulties as ``The German Problem''. Otherwise, we just had to isolate what needed to happen in real time:
The spectrometer needs to start sampling at precise intervals from the last start-of-sample.
The spectrometer needs to sample for a precise duration.
Data coming in over the serial port asynchronously also needs to be handled.
Data coming in from everywhere needs to have an accurate timestamp.
We constantly were tempted to include more functionality in the real-time part of the system, but we always came back to implementing these very basic goals in the real-time part, then adding anything else that was not real-time critical in user space. I can't emphasize enough how important it is to define your real-time goals precisely and stick to them. Doing this at the beginning would have saved us a good amount of time.
To accomplish goal number one, we relied on the periodic scheduling function of RTLinux (see the man page for pthread_make_periodic_np). We created a pthread to do the sampling from the spectrometer. This thread is woken up any time there is a state change in the spectrometer (from stopped to sampling, from sampling to reset, etc.). Depending on the state, the thread either immediately suspends itself (if stopped) or runs one spectral sampling cycle and then suspends itself. If the software is in the sampling state, it continues to wake the thread at precise intervals. It appears that there is only about 20ms or so overhead on the system, so we can sample almost as often as our spectral integration time allows.
Goal number two is accomplished by taking advantage of the spectrometer interface electronics internal timers. The hardware was intended to sample at intervals of its own internal timer, so we stayed with this design. Basically, our software sets the integration time for each spectrometer, tells each to start and then monitors them for completion. Because the specs time their sampling using their own timers, even if we read some spectrometer data a little late, it is guaranteed to represent the correct integration time. This is important when there is data coming in asynchronously over a serial port.
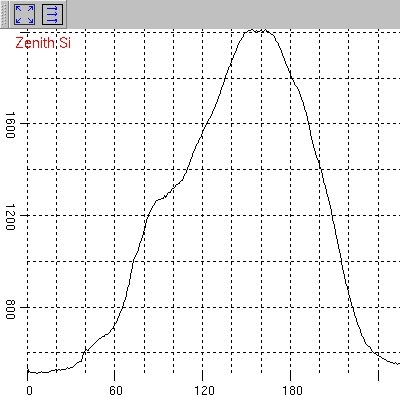
A real-time plot of Zenith Si instrument spectrometer data: the plot shows the spectral intensities of a light source, in this case, a handheld flashlight. The system allows real-time plotting of data from all instruments simultaneously.
Goal number three is accomplished by taking advantage of the rt-com real-time Linux serial port drivers (http://rt-com.sourceforge.net/). The interface to rt-com is based around doing reads and writes to the serial ports, but what we wanted to do is get serial data in as soon as it appears at the port. So we modified the internal interrupt service request routines in the rt-com package to call a function every time data comes in through the serial port (in the rt_com_irq_put(...) function). There is a potential problem here with serial data coming in while we should be starting a sample or reading in the data for one. This problem is handled by disabling interrupts when the spectrometer sampling thread begins the spectrometer turn-on process. It is possible that this could be delayed slightly by the rt-com interrupt service routine, but this isn't really a problem if timestamping is done accurately. It is also possible that some serial data can come in while interrupts are disabled. This continues to be a problem, but we have tried to alleviate this by minimizing the amount of code that is run with interrupts disabled. Notice that the integration time of the samples is not affected by the asynchronous serial data, due to their reliance on the internal spectrometer interface timers.
Goal number four is achieved merely by taking advantage of the nanosecond-resolution timing hardware, which can run alone or be connected to an external IRIG-B timecode generator (coming from the aerial platform). Although RTLinux appears to provide a satisfactory timer in itself, the IRIG-B timecode will let us synchronize our spectrometer data to the data coming in over the serial port (which is time-labeled by the same IRIG-B timecode generator, which we can compare to our timestamp). The IRIG-B also will give us a time context in relation to everything else on the plane and solve the timing problems that there would be if, for example, the SSFR needs to reboot in-flight. The timing module has a very simple interface, a nanosecond read latches the time, and the software just has to read in nine bytes worth of BCD (Binary Coded Decimal) data. If the IRIG-B is not available for some reason, the software timestamps using a simple call to RTLinux's gethrtime().
The RTLinux driver software communicates to its user-space counterpart through four real-time FIFO interfaces. It streams spectral and serial data out through two of the FIFOs, accepts control commands through another and reports state and nondata information through the fourth. This achieves a pretty good separation of the different data that needs to go back and forth, and allows data and control information to come in at different rates and still be handled by the user program. The basic user program simply waits on a select() between the two data and control response FIFOs, as well as stdin. This provides a rudimentary control interface for the SSFR from a console. Besides the interface, the basic user-space program serves to match up temporally the data that comes over the serial interface with spectral data, as well as to act as a data distributor to multiple output destinations.
On boot, the system runs an init script that runs the RTLinux start scripts, inserts the kernel module for the spectrometer and runs the user-space program in autonomous mode, with some default parameters for the integration time and the like coming from the script. If there is an actual real person attending the SSFR and they want to use the GUI, they either start up Linux in a different runlevel or just abort out of the user-space program. The user then runs a script to get the GUI version going. We built the GUI with Qt, which we currently run with the regular Qt libraries on top of the KDrive tiny X server (http://www.pps.jussieu.fr/~jch/software/kdrive.html), part of the XFree86 Project. KDrive is fun because it uses no configuration files, so if you want to do something like use a different mouse, you have to edit the source and recompile. Right now, we run KDrive and the excellent Blackbox window manager (http://blackbox.alug.org/) in about 800k, which isn't very bad at all, considering that we have a substantial amount of memory for an embedded system (32MB). At some point soon we're going to try out Qt/Embedded with the system, but using an actual X server gives us the flexibility to run other non-Qt programs concurrently with the SSFR software while it is in use. We also used BBKeys (http://movingparts.thelinuxcommunity.org/bbkeys.shtml) to allow us to use the system better with no mouse installed.
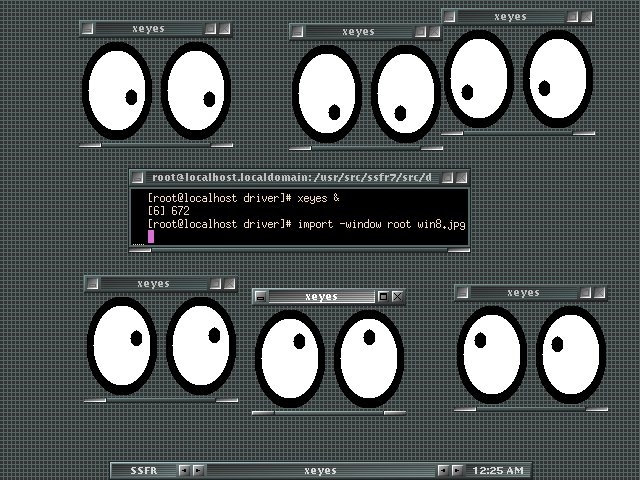
Running multiple copies of xeyes is an integral part of the operation of the Solar Spectral Flux Radiometer. Notice that we are running the Blackbox window manager on the kdrive X server, which allows the flexibility of running any X application yet consumes minimal resources.
One concern in building the GUI version of the software was that X would die and would kill the process that writes the data to disk. We wanted to avoid this, so we made sure to separate the core from the interface at the process level. We did this also to enforce consistent interaction with the SSFR in its command-passing and data-receiving functions, so we would not find out later that there is something like a subtle timing difference in data obtained when running the GUI or not running the GUI. So when the user program is started in GUI mode, it fork()s and exec()s a Qt application, communicating with it via plain-old UNIX pipes. These pipes take the place of the stdin and stdout functions in the rudimentary interface, and one also becomes another output destination (in addition to the disk writer). Now, if the GUI dies for some reason, the core user program won't quit on us. It also allows us to lower the process priority of the GUI to help insure that everything gets written out to disk properly, if need be (although in practice, this hasn't been a problem). In the future, we are also probably going to have the data be routed out of a serial port (in addition to recording and graphing), as some aerial platforms allow instruments to broadcast data to the ground for live analysis. It would be very conceivable that a future system could use the current plotting portions of the GUI to monitor data being broadcast from the plane in real time.
When writing the interface, it was very helpful to think of the user-space program as the controller for a little robot that resides in the RT kernel code. That robot can be in a series of states, and the user-space program's job is to tell it to change into another state, or it can change states on its own. So we have a controller issuing orders over a control FIFO, and the robot gives us updates as to what it's up to over a response FIFO. Any time we tried to assume that the SSFR was going to do things synchronously with what we were telling it to do (for instance, assuming that it was no longer in a sampling state immediately after it returns its last spectral data package in a series), we ran into trouble. So, remember to listen to your little robot.
The graphical interface itself was started in the Qt2 Designer program from Trolltech, which was easy to work with and made the task of laying out a window with a lot of buttons very easy. The functions of the interface boiled down to being able to change some control parameters and look at the pretty data coming in. The GUI was constructed on another machine using a fake SSFR that would connect to the control program over some named pipes and simulate the performance of the SSFR hardware. This sped up development considerably, as a largish Qt program can take quite a long time to compile on a slower, lower memory system such as the SSFR.
We were able to use David Watt's rtp real-time plotting library featured in the May 2000 issue of Linux Journal (http://www.linuxjournal.com/article.php?sid=3921) as a basis for our data display. The outstanding feature of rtp is that it won't try to finish plotting a current data set if another set comes in before it finishes, so it can't get backed up. Because of the potential for plotting a lot of data at once, as well as the resource requirements of the rest of the system, this was a key consideration for its use. We modified the functions of rtp to take spectral data or temperature data directly over a function call (not over stdin), then plot over a fixed area, either over the 256 bins of our spectrometer instruments or a time-tracking temperature plot with a moving time window. We then hooked this up using Qt's QSocketNotifiers, so that data coming in over the pipes would immediately get sent out to whatever data plotters were activated, without resorting to anything silly like polling.
At the time of this writing, we are putting the finishing touches on the system. It will then be tested many, many, many times on the ground to make sure that it functions correctly and that the data it produces is accurate. But the big test comes this summer when the new software makes its debut during the CRYSTAL-FACE (Cirrus Regional Study of Tropical Anvils and Cirrus Layers Florida Area Cirrus Experiment) Mission. This will be a very exciting time both for me personally and also for embedded Linux. I'm hoping that this project will help to raise awareness of the advantages of using Linux for this kind of project at NASA and everywhere.

Sam Clanton is originally from Omaha, Nebraska and walks around with rubber balls in his hands to protect his good reputation if he is ever caught walking around with apples in his cheeks. He now lives in Silicon Valley, but misses Baltimore sometimes.
email: sclanton@mail.arc.nasa.gov

