
Hunting Hurricanes
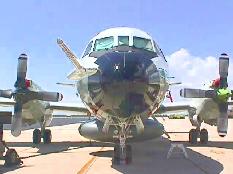
Figure 1. Front View of NOAA-43, One of Two WP3Ds
In March 1998, we started development of a new Linux-based data system for the NASA Goddard Space Flight Center scanning radar altimeter (SRA). The goal was to significantly reduce the system weight and volume to enable its installation on one of the NOAA hurricane hunter WP3D aircraft (see Figure 1) for the 1998 hurricane season. The SRA measures hurricane directional wave spectra and storm surge. The data will ultimately be used to help refine and improve hurricane models and improve forecasting and understanding.
The 1998 hurricane season was quite active and the SRA successfully flew in hurricanes Bonnie, Earl and Georges, collecting almost 50 hours of actual mission data.
Our principal obstacle was the short time frame until we needed to be operational onboard the hurricane hunter. The size, weight, complexity and power consumption of the SRA were also critical design items because of floor loading considerations and the limited payload capacity of the P3 aircraft when operating on long (10-hour) missions in turbulent weather conditions (hurricane-eye wall penetrations). Interrupt response time, crash-proofness and freedom from “lock-ups” were all important considerations when choosing the operating system for the SRA.
The new SRA data system, built on top of a Red Hat 4.2 system and Linux kernel 2.0.29, occupies eight inches of vertical rack space, weighs about 40 lbs, runs totally from an internal 12-volt aircraft battery and requires about 120 watts of total input power. It includes a custom ISA board with several PIC microchips which perform dedicated functions for the radar. It also includes the entire radar IF (intermediate frequency) strip, detectors and a 2ns/point waveform digitizer. No monitor or keyboard is directly connected to the SRA; instead, Linux laptops are used for all control and display. Those laptops run Red Hat 5.1 and 2.0 Linux.
The RT-Linux (Real-time Linux) software does the following:
Drives the waveform digitizer.
Computes the centroid-based range measurement between the transmit and return pulses.
Manages 96 automatic gain control loops.
Corrects for aircraft attitude and off-nadir angle.
Deposits formatted data in a shared memory block from which a normal Linux program extracts and records it to a disk file.
The SRA makes extensive use of Tcl/Tk and the Blt graphics library for real-time display.
Post-processing of SRA data is done with Yorick, a free and very powerful programming language that runs on Linux, a wide variety of other UNIX platforms and MS Windows.
The previous implementation of the SRA was developed in 1988 using an array of 68020s on a Multi-bus-I backplane, a CAMAC crate full of nuclear physics instrumentation and a combination of UNIX and VRTX (VRTX is a real-time kernel). VRTX ran on real-time processors and UNIX ran on the system host. The CAMAC crate was quite heavy, consumed considerable power, occupied substantial rack space and was expensive. It used hardware time-interval units (TIUS) to measure the time for a radar pulse to travel from the aircraft to the ocean and back. It used “threshold detection”, which caused the TIU to stop and a CAMAC-based waveform digitizer to acquire the return waveform. The waveform data required its own 68020 processor to “process” each waveform and extract certain data. The data were used to refine (post-flight) the range measurement made by the TIU. Threshold TIUs suffer from an effect known as “range walk”, which causes the measured range to vary as a function of the strength of the return pulse. The array of processors communicated with each other via a 4MB memory card which resided on the multi-bus. Control of the system was via a character-based terminal and real-time display was done on an SBX Matrox graphics module which was managed by its own 68020 processor. One of the 68020 processors ran UNIX; that processor ran programs which extracted radar data from the 4MB card and stored it on a 9-track magnetic tape or a disk file. The UNIX processor hosted all software development and managed the operator control terminal.
Due to its volume, weight and power consumption, we were unable to install this version of the SRA on the hurricane hunter. Limitations in the hardware signal-tracking circuits would frequently falsely trigger the system on a side lobe and effectively eliminate the true range measurement.
Figure 2. Block Diagram of the SRA Sensor
The SRA is an airborne, 36GHz, down-looking, raster-scanning pulsed radar. A simple schematic block diagram of the sensor is shown in Figure 2. Its one-degree beam (two-way) is scanned across the aircraft flight track and a precise time-of-flight measurement is made for each of 64 pulses transmitted at 0.7 degree intervals across the scan. As the aircraft proceeds, a topographic image of the surface (normally ocean waves) is developed, recorded and displayed. The nominal ranging accuracy of the SRA is 10cm. Three differential carrier-phase GPS receivers are used to measure the exact location of three GPS antennas mounted in an array on top of the aircraft. A ground-reference GPS is set up where the flight originates and the ground and aircraft GPS data are processed post-flight to produce an aircraft trajectory, typically accurate to about 30cm in our application. Higher accuracies are possible when operating under less stressful flight conditions.
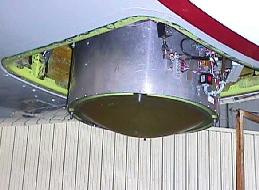
The SRA radar consists of a 20-inch Rexalite lens, a feed horn on the lens axis which looks up into a mechanical scanning mirror that mirror-images the feed horn to the focal point of the lens, a pulse modulator and RF exciter, receiver, 1.7KW Extended Interaction Amplifier (EIK) and the RT-Linux data system. The data system is the topic we will discuss here. Figure 3 is a photograph of the SRA scanner installed on the NOAA hurricane hunter. The fairing is removed in this photo.
Figure 4. SRA Data Power System
Figure 4 is a block diagram of the SRA power system. The SRA requires an uninterruptible power source for Linux and the three differential GPS receivers and computers. Instead of an off-the-shelf UPS, we went with a 12-volt 25 AH “RG” (recombinant-gas) sealed aircraft battery as the prime power source for the system. This was chosen for two reasons:
We needed an uninterruptible power source, because aircraft are notorious for power dropouts during engine start and shutdown.
We needed to power our 12-volt GPS receivers for up to an hour before and after each mission without aircraft power applied.
We purchased a 12-volt input 150W PC power supply to power the data system. The battery can power the data system and the three GPS receivers for about two hours, or the GPS receivers alone for five hours. We located the battery in the rear of the custom data system housing.
Figure 4 depicts the wiring of our power system.
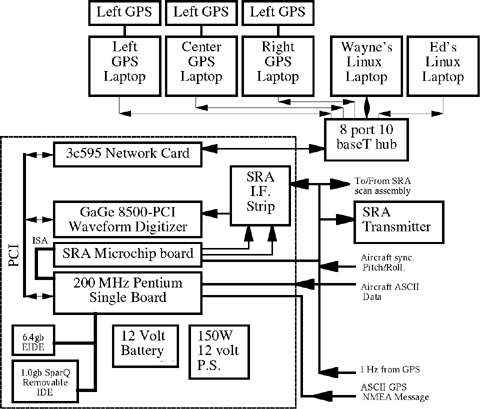
Figure 5. Block Diagram of the SRA Data System
Figure 5 is a block diagram depicting the internals of the SRA data system. The computer is a single-board 200 MHz Pentium which plugs into a passive backplane with ISA and PCI slots. The CPU card contains PCI-VGA video, PCI-IDE controller, PCI fast-wide SCSI controller, 64MB of RAM, 512MB of cache, two serial ports, a parallel port and the CPU. A PCI 3c595 network card provides networking and a special-purpose ISA card loaded with PIC microcontrollers provides an interface to the radar systems. A 6.4GB EIDE disk drive is used as /dev/hda to hold Linux and for data storage. A backup SparQ 1.0GB removable drive is installed as /dev/hdb. The system has no floppy or CD-ROM drive. If a CD or floppy is needed, they are simply remotely mounted with NFS from one of the Linux laptops which have both. No keyboard or monitor is used for normal operations, though they can be plugged in if the need arises.
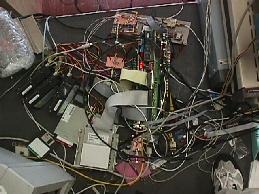
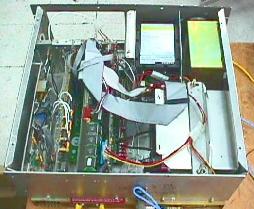
Figure 6. The SRA Data System during Development
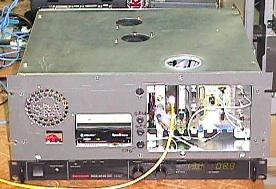
Figure 7. View of SRA Data System Internals
Initially, we used a 4.2GB SCSI drive, but that used too much electrical power. Early development was done using a 250W 117vac PC power supply. When we switched to the 12-volt input 150W power supply, we discovered we were over our power budget by 25 watts or so. During the boot process, the power consumed by the combination of the SCSI drive and the waveform digitizer would cause the power supply to “spike” the 5-volt source and cause a reboot. It took us several hours to find this problem. It would generally happen just as Linux began loading, due to the digitizer being powered up and the drive being accessed. During the DOS boot, the digitizer was not powered until after DOS booted and after the digitizer configuration program loaded and ran. Consequently, the loading of Linux was the straw that broke the camel's back. We finally settled on a 6.4GB EIDE disk drive for Linux and for data storage. The power consumption of the EIDE drive is substantially less than the SCSI and no perceptible difference is seen in performance of the data system.
Figure 6 is a photo of the SRA data system during development. It was in this “state” until just a few days before our first test flight on the NASA C-130. Figure 8 is a photo of the data system after packaging. Figure 7 shows the internal organization of the data system as viewed from the top rear. The enclosure is reversed from most rack mounts. We wanted to have ready access to the computer card connections without having to remove the rear rack cover. The only connections on the rear are for the GPS receivers and the battery charger. The black power supply under the data system in Figure 8 is our prime power supply/battery charger.
The core data acquisition device in the SRA is the GageScope 8500-PCI waveform digitizer. It provides for up to 128KB of sequential samples taken every 2ns (nanoseconds). This permits us to digitize a 256-microsecond waveform. We actually digitize for 60 microseconds, beginning a few hundred nanoseconds before the radar pulse is transmitted and ending after enough time has expired to accommodate a signal return from our highest possible altitude. The pulse takes 2 microseconds to travel 1000 feet and return, so to accommodate a maximum altitude of 30,000 feet, we need to digitize at least 60 microseconds. Since a point is digitized every 2ns, there will be 30,000 points in each waveform. We don't read all 30,000 points out of the digitizer. We “track” the position of the returns and read out only 256 points centered around where we expect the return to come from. Since the ocean is basically flat, this technique works well.
The driver code provided by Gage for the 8500 supports DOS, Windows and Windows NT. It is extensive, to say the least. It contains several thousand lines of code solely to initialize most of the cards that Gage makes to an operational state. Apparently, much of the functionality of the card is loaded into programmable Logic Arrays from the DOS driver. The Gage driver code supports virtually every waveform digitizer made on several different OS platforms. They make extensive use of conditional compilation to select both the desired digitizer board and the desired operating system. They attempt to establish an isolating layer of driver code, so that a common set of driver calls appears to the users of their supplied library.
After looking at the driver start-up code, we though it might take more time to port the start-up code to Linux than we could afford. In order to avoid porting the long and complex start-up code, we elected to make the system dual boot Linux and DOS. This scenario has worked well, permitting us to get a DOS program going quickly which would configure the digitizer. After the digitizer is configured, the autoexec.bat DOS script loads Linux using loadlin, a DOS program which can load a Linux kernel from DOS. The DOS digitizer start-up code leaves the digitizer in a known functional state. The code required to use the digitizer is actually not very extensive and only requires accessing a few registers and memory locations on the Gage card. The folks at Gage were very helpful in getting it working.
Waveform data are extracted from the digitizer after a radar pulse event has occurred. One of the 16C65A microcontrollers controls all aspects of triggering the transmitter, actuating various gates, triggering the waveform digitizer and finally interrupting the Linux waveform digitizer interrupt handler.
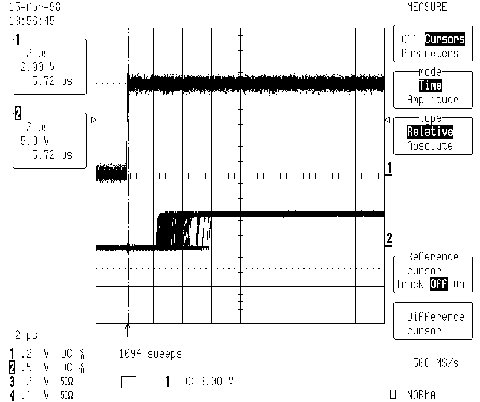
Figure 9. RT-Linux Interrupt Jitter
The RT-Linux interrupt typically responds in 2 microseconds (on our 200MHz Pentium) with occasional jitter to several microseconds. When we did this same test with MS Windows a couple of years ago, we found the fastest response to be on the order of 50 microseconds (486-dx2 66MHz) with jitter well into tens of milliseconds. It is incredible just how responsive Linux is to interrupts. Figure 9 is a digital scope capture, where the top trace rising edge is the actual hardware interrupt signal on the ISA backplane. The bottom trace is a hardware signal generated by the interrupt code. It simply wrote a “1”, waited awhile, then wrote a “0” to the printer port. Each horizontal division is 2 microseconds. This demonstrates the typical latency of our RT-Linux system. Concurrent with this test, we ran a find command in another xterm so the system had something to do.
Microcontrollers permit very hard and reliable real-time capabilities. They are well-suited to replacing arrays of chips and digital logic in many applications such as the SRA. We designed a special ISA interface board for the SRA which encompasses most of the special requirements of the radar and special interfaces.
The board is presently populated with four Microchip 16C65A microcontrollers. One microcontroller implements a real-time clock which automatically maintains time-of-day synchronization with our GPS receivers. It has a least significant fractional time bit of 200 nanoseconds and provides the SRA with up to 64 bits of accurate time information. This chip automatically captures the trigger time for each radar pulse. It and its neighbors can all be read and written by Linux.
A pair of microchips function together to convert the scan encoder pulse trains into radar trigger events. As our scan mirror rotates, a scan encoder measures the scan angle. At our scan rates, it produces a pair of 40KHz square-wave signals which are 90 degrees out of phase. One microchip is programmed to combine these two signals together and produce a single 80KHz signal, which is then counted to determine the position of the scanner. The second microchip is programmed to count the 80KHz signal and initiate a radar pulse at predefined angles. With its 200ns instruction time, this microchip directly controls all aspects of the transmitter and receiver electronics and also generates an interrupt to Linux once a waveform has been acquired by the waveform digitizer. For each SRA pulse, this microchip:
Protects the receiver front-end from damage.
Verifies that the receiver is protected.
Gates the digitizer on.
Gates the EIK amplifier on.
Delays exactly 200ns.
Triggers the transmitter modulator to generate an 8ns pulse and causes the real-time clock microchip to capture the present time.
Delays 200ns for the transmit pulse to be well clear.
Enables the receiver to receive return signals.
Interrupts the RT-Linux SRA module to extract the waveform data from the digitizer.
RT-Linux is a patch which gives Linux many of the most important features needed by real-time programmers and embedded-system designers. It is implemented as a set of modules which can be installed and removed using insmod and company. You also use insmod to install any real-time code you write. RT-Linux programs execute in the kernel space and have full access to the system hardware and kernel code as well.
We've done a considerable amount of development using Turbo-C and DOS in the past, and it is truly amazing how infrequently we had to reboot Linux during development of the SRA. Back under DOS, we usually had to reboot several times per day. With Linux, we had to reboot only three or four times during the entire development period.
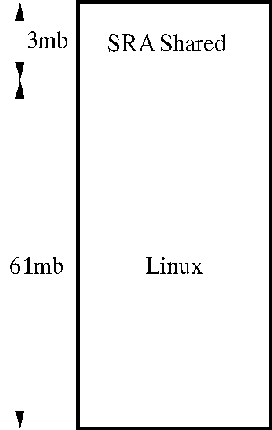
Once the RT-Linux programs/modules capture the data, they must be written to storage and displayed for the system operator. We accomplish this by using shared memory. The SRA has 64MB of RAM and we configured the kernel to boot using mem=61m which causes the kernel to manage only the lower 61MB, leaving 3MB untouched. It is this 3MB that we use for real-time data capture and as a common communication buffer area between RT-Linux modules and normal user-space programs. Figure 10 depicts the SRA memory usage.
We wrote a single C program (rgc.c) which provides most of the interface between Linux user mode and RT-Linux. This program is a simple command-line style program with tons of commands to read and write data space in common between RT-Linux and user space. Most of our Tcl/Tk scripts merely open a pipe to this program and use it to pass commands and extract data from the system. The program can also be used directly from the command line. This makes development and debugging simpler.
One of the run-line options to rgc causes it to loop, testing for data to be written to disk. If no data are ready, the program sleeps for one second. If data are ready, they are extracted and written to the specified disk file.
We use up to five laptops on the SRA at once: three for collecting GPS data (one laptop for each GPS receiver) and two for control and display of real-time SRA data. A personal laptop is used for control, and if we're both on the flight, we can both run several instances of the same display programs using another personal laptop. We each have our favorite color-bar for the image of the sea. We'll frequently use one machine to control the SRA and the other to write or modify display or system software as we're flying. The laptops are Chembook 9780s. Each has a 4GB internal hard drive and a modular 6.4GB drive (in place of the floppy), a 14.2'' XGA LCD display, PCMCIA Ethernet card and a 233MHz Pentium-Pro CPU.
Each of these machines dual boots either Red Hat Linux 5.1 or MS Windows 95. To use the laptops as X terminals, we boot Linux, then run the Xfree86 server. We run the X server such that the laptop becomes an X terminal for the SRA data system. This puts most of the burdensome display processing on the laptop processor, since the X server seems to be where the CPU cycles go. There are two ways to cause X to act as an X terminal. The first is:
X -query
and the second:
X -indirectThe target machine must be running XDM (X display manager) for this to work. The first method will link directly to the target machine, where you see a typical XDM login prompt. This first method is what we use when controlling the SRA data system. The second method will give you a list of all the machines known on the network to support XDM or X terminals. It is useful back at the lab where many potential hosts are available to pick from.
You can even have two or more X servers running at once. Here's an example:
X -query first-machine
X :1 -query second-machine
X :2 -query third-machine
X :3 -query fourth-machine
You can get a local X server going with the command:
startx -- :4The SRA system configured for storm-surge measurements consists of three Chembook Pentium laptops which dual boot Linux and DOS. The GPS data acquisition program was written for DOS, so each laptop runs this DOS program when collecting the GPS data. After the mission, we reboot the machines to Linux and transfer the data to the SRA data system where it is archived with the other mission data. Once it is all together, we transfer it to the two laptops. In this way, we have triplicated the data. We then take the laptops with us back to the hotel and begin analyzing the data. All five laptops and the SRA data system are on a 10baseT Ethernet network.
Some aircraft data are read via RS-232. For this, we are using the standard /dev/ttySxx ports and drivers. The aircraft data are in a 9600 baud stream occurring once per second and the GPS produces a position message twice per second. We use our GPS message to drive a simple Blt plot of the latitude versus longitude, so we can track the progress of the flight.
The RS-232 data are actually captured by the rgc program, since the RT-Linux modules can't make use of the native Linux drivers and we didn't need to rewrite drivers that were working perfectly. Once the data are read, they are copied to the shared memory area above 61MB where any of the programs can access it. Normally, it is accessed by another invocation of rgc and read.
Accurate aircraft attitude, heading and track angle data are critically important to the SRA in real time. The pitch-and-roll attitude of the aircraft is taken from the on-board Inertial Navigation Units (INU), using Synchro-to-digital converters—one for each parameter. These are read by the RT-Linux module during each scan line. The heading and track information is presently provided via RS-232 from the on-board aircraft data system, which has a direct interface to the INU's digital data stream.
The SRA radar data are written to disk files by the rgc program. The aircraft data are captured by a separate program and written to a separate disk file. This data is normally captured for the entire duration of the flight, providing a complete flight record in a single file. The carrier-phase GPS data are captured continuously from 45 minutes before the flight until 45 minutes after the flight. The pre- and post-mission data are necessary to resolve the aircraft position to the centimeter level.
Before any Linux development was carried out, we felt it necessary to write some DOS code to work with the Gage digitizer board. Turbo-C version 5.0 was required to compile and use the Gage-supplied library. Once we were successful in getting a Gage example program to work on DOS, we worked with Gage engineers to communicate directly with the digitizer using a normal user-mode program. The main trick was to make the DOS program configure the digitizer and then exit without powering it down. The second trick was to boot from DOS into Linux; this turned out to be quite easy with loadlin.
We determined the PCI board settings for the digitizer by reading /proc/pci and then hard-coding various test programs with the values. We wrote various normal user-mode programs to become familiar with the digitizer. We were able to manipulate the digitizer card in every way except handling interrupts. The gdb debugger was a big help throughout the development.
A substantial part of the SRA software is actually firmware resident on various microchips.
Microchip provides, at no cost, a very complete and easy-to-use development package for their 16C65A (and other) microcontrollers. It sports a comprehensive simulator, making it possible to watch simulated execution of quite extensive programs. The only downside is the system runs only on MS Windows.
The RT-Linux extensions provide just the right features for a real-time data system such as the SRA. The extensions provide much more capability than we actually use in the SRA. We use it to start an RT task at the end of each raster scan. The task processes all the data captured during the previous scan and makes a number of calculations necessary to configure the system for the next raster.
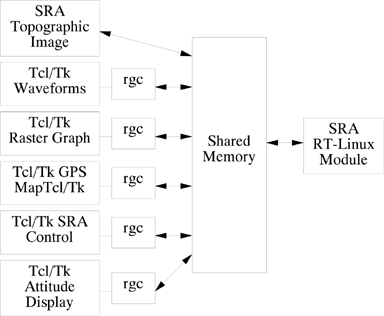
Figure 11. SRA Progam Block Diagram
We wrote rgc.c to be a liaison between normal user processes under Linux and the RT-Linux SRA module. Quite simply, rgc sets up a pointer to the shared memory space that the SRA RT module uses for data storage. They understand each other because they share a common .h file defining the data organization in the shared memory space. Figure 11 depicts how the various SRA real-time programs communicate with each other. rgc usually reads commands from stdin and writes to stdout. If it is invoked with certain switches, it forks and polls for RS-232 data and/or writes captured data from the shared memory to disk, all the while taking its commands from stdin. The command set is simple ASCII strings such as set thresh 24 or get roll. The Tcl/Tk programs each open a pipe to their own private rgc, then send commands and receive data back. Everything is done this way except the topographical image display. That program, creep.c (because it creeps up the screen), accesses the shared memory directly. The main reason for concentrating everything into rgc is that it generally means we need only recompile rgc, creep and the SRA module when something is added or removed in the shared memory area. In short, it makes for quicker development.
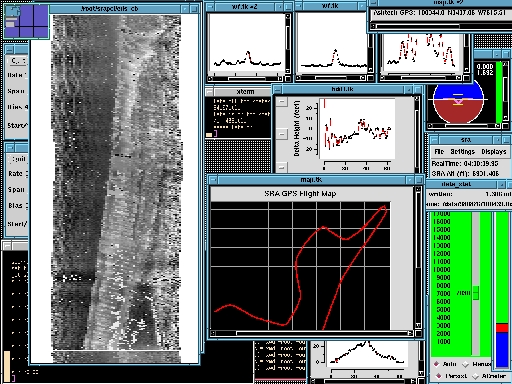
Figure 12 is a screen shot of the SRA control laptop during hurricane Bonnie's landfall. The image on the left side of the screen is the real-time topographic display. It is gray-scale encoded so that the higher things are, the more white they appear; the lower, the darker. This image clearly shows waves on the left side of the image, the beach in the center and a very distinct dune line. We also have a color-encoded version of this program, but its interpretation is not as intuitive. The blue/brown display represents the attitude of the aircraft. It is a short Tcl/Tk script which reads aircraft attitude data captured by the SRA RT-Linux module.
Figure 12. SRA Screen in Operation during Bonnie.
The bright green display shows how we control and designate the operating conditions for the SRA. At this time, we manually find the return signal using the slider. Once found, we click the “auto” button and the system will keep the ground in the center of our digitizer window, regardless of aircraft altitude variations. The flight map is yet another short Tcl/Tk program. It extracts GPS position data from the shared memory area and uses it to map our position.
Tcl 7.6 and Tk 4.2 with Blt 2.3 are used extensively in the SRA. Initially, we thought it might be useful only for prototyping, but it soon became obvious that the X server would be the display bottleneck and not Tcl/Tk.
During development and before we purchased the laptops for control, we used a monitor connected directly to the SRA system. This meant that the X server would run there too. When we began experimenting with using a remote X server, we quickly discovered that the burden of the X server had also moved to the remote system. This was a no-effort way to automatically distribute the load across one or more computers in the system.
We wrote the image display in C using the Xview library. We used this library because we already had a book about it, and it didn't look too difficult to use. It writes each scan line directly to the display and simultaneously to a “pix-map”. When a “repaint” event occurs, the pix-map is used to repaint the whole image. A great way to put a load on the display computer X server is to grab the image map and move it around the screen. The load on the displaying computer will go through the roof, but the data system will remain unaffected.
Once we had some SRA data, we obviously needed to build some software to review it. We wanted to have SRA processing software on several machines and without licensing hassles. That way, we would be able to develop programs at home, on an office laptop (which is also used to control the SRA), on the SRA data system computer and on office Linux and Windows PCs. In total, we needed processing on at least five to ten different systems. We considered IDL, Matlab and Yorick. Our tool of choice for processing was Yorick. It is free, very powerful and will run on a wide variety of platforms including almost every UNIX machine known, Linux and Windows. It has the ability to save data so it can be read on a big-endian or little-endian machine.
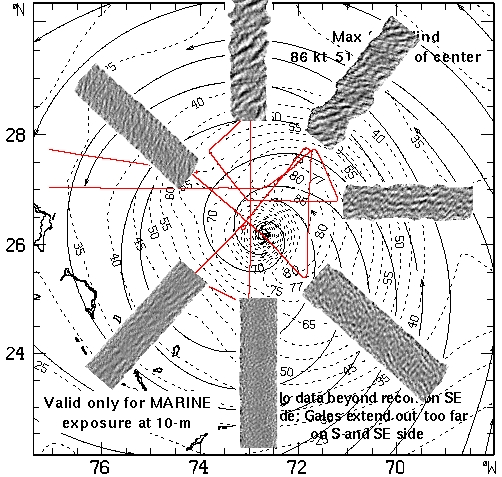
Figure 13. Initial Data Product from Yorick Showing Surface Topographic Images Superimposed on NOAA Wind Plots
We first heard of Yorick from an article in Linux Journal (“The Yorick Programming Language”, Cary O'Brien, July 1998). We downloaded it and gave it a try. We like its C-like syntax and ability to load (and reload) individual functions of a program. This makes for a very powerful and flexible development environment. One of its best features is its cost—free! To put either Matlab or IDL on all the machines would have been prohibitively expensive. Since we have Yorick on the SRA data system and on the controlling laptop, we can easily analyze data in the field with minimal effort using the Linux laptop. Figure 13 shows topographic images from the SRA overlaid on a wind field plot from the August 24th flight. The sea state was above 18 meters (60 feet) on the northern flight line.
We had two or three short test flights on the NASA C-130 aircraft before we had to pack everything up and ship it to MacDill Air Force Base in Tampa, Florida, for installation on the NOAA hurricane hunter. We removed a number of bugs during these test flights, but not all. When we shipped the system, it still would not track properly.
Once we were all installed on the hurricane hunter, we had a 6-hour test flight. This permitted us to work out almost all of the bugs we had seen earlier and a few new ones. We still had a few problems with the tracking code, which would not track reliably.
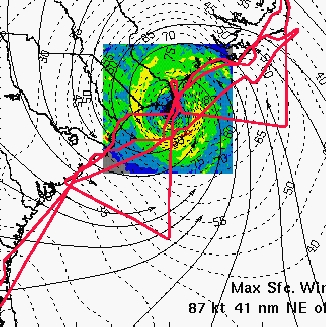
Figure 14. Flight Track during Bonnie's Landfall
We flew two missions in hurricane Bonnie: the first on August 24 and the second during landfall on August 26, 1998. During our first transit flight from Tampa to the storm, we were able to isolate and correct the tracker bug and everything started working better than expected. Soon after leaving the east coast of Florida, our topographic display of the sea came alive for the first time, showing real sea state. Ocean waves as high as 63 feet were observed in the northeast quadrant of the hurricane on the 24th. Figure 14 shows our August 26 flight track during landfall overlaid on the aircraft weather radar image and a contour plot of the wind field data. The base image includes the weather radar, the wind field and the coastline and was provided by the Hurricane Research Division (HRD) of the NOAA Atlantic Oceanographic and Meteorological Laboratory (AOML) in Miami. We produced this overlay using Yorick.
In addition to hurricane Bonnie, we also flew in Earl and Georges.
Thanks to the reliability of Linux and all of the off-the-shelf real-time data processing programs available in that domain, we were able to put together a state-of-the-art data system on a very tight schedule with a great variety of real-time displays. The displays proved to be of great value both in troubleshooting during development and in real-time geophysical assessment and interpretation during data acquisition. As a result, we were able to document for the first time the spatial variation of the wave field in the vicinity of a hurricane and the spatial and temporal variation of the storm surge associated with hurricanes on landfall.


