
MTool: Performance Monitoring for Multi-platform Systems
Quite a long title for such a small software package, but it describes exactly the content of this article. In our networked world, the amount of information is growing and becoming less manageable. The first idea for developing a performance tool came from the CERT engineer (Gygi), who works for one of Europe's academic networks—SWITCH, Swiss Academic and Research Network. SWITCH's head office is located in Zurich. Less than two dozen highly qualified engineers operate some 50 sites throughout Switzerland as well as the central SWITCH system at ETH Zurich computing center.
While SWITCH is already using some performance monitoring tools, the procedures are far from satisfactory. Each time the engineers want to monitor a remote system, they have to log in and use common tools such as top, ps, df, etc. This introduces undesirable security risks.
What SWITCH needed was a simple, reliable, secure tool that could be easily used from any authorized place in the network (or Internet). The tool should be compact—it must not use much of the system's resources. Furthermore, it should be multi-platform oriented. Even though SWITCH maintains mostly Sun workstations, the number of Linux boxes and other UNIX systems that they monitor is not negligible. As a first step we were interested in monitoring basic system resources: CPU/memory/swap usage and some specific processes (daemons such as inetd). These resources provide a snapshot of a monitored system. In the second phase we decided to observe some additional parameters such as network traffic, disk usage, user/ftp connections and some other processes.
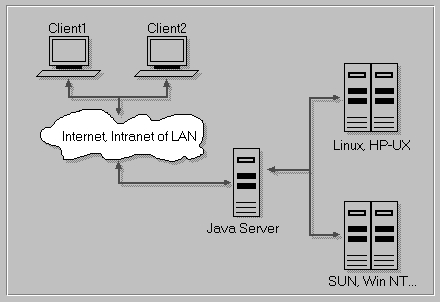
The demands for a multi-platform, secure tool brought us to a simple decision—Java. As we have a strong students' Java team at our lab, Java was chosen as the basic development tool. Java is a network-oriented, robust tool and provides enough security for our requirements. We won't go into details of the language, but it was also clear that Java was not appropriate for the system-level programming needed to access system resources. For that reason, we chose a three-tier architecture (see Figure 1). This architecture represents a response to some of the drawbacks of the standard two-tier client/server network architecture. Client/server applications are quite easy to program; the problem is how to manage client-side software. The problem is even bigger when we require a multi-platform environment. Three-tier architecture introduces so-called middleware (e.g., the Java server in Figure 1). Basically, the middle software residing on the server represents a bridge between a client and a server. The middle tier is not only capable of handling more client connections, but also provides a more secure method of communication. Since the middleware and the client part can be written in Java, we come to a very important issue—platform independence.
Clients are no longer expected to use platform-dependent code. Even more, a copy of a Java-enabled network browser such as Netscape would suffice. Developers can now take a break, since they don't have to write a lot of platform-dependent versions of their software. This basic idea is also used on network computers (NC). Whenever the developers change the client's code, a new version can be made available for distribution on the middle-tier server. Then next time the client runs the program, the new version is automatically downloaded. The platform-dependent software which provides information to the clients over the middleware is written in ANSI C. The communication between middleware and the server is done using sockets.
As we have already mentioned, we had a daemon (mtoold) written for Sun workstations since they represent a majority in Switzerland's academic network. However, our environment is mainly equipped with HP workstations; we also have more than 70 Linux boxes around the classrooms and labs, as well as Windows 95/NT computers. We've learned a lot from Linux since 1993, when we built our first Linux box using the 0.99pl15 kernel. Linux has made tremendous progress since that time.
Thus, for us, Linux as a development “playground” was a logical choice. Linux has a well documented /proc file system. (See “The /proc File System and ProcMeter” by Andrew M. Johnson, Linux Journal, April 1997.) Linux is the best documented operating system available. What we missed most was a good Java development tool. If Linux had a GUI like Symantec's Visual Cafe, we would have been very happy indeed. At that time, we were still forced to use the command-line Java compilers and interpreters that come with the standard Java Development Kit (JDK 1.0.2 or JDK 1.1.1). So, we used Visual Cafe under Windows for creation of the user interface, then manually added some specific code.
Three-tier architecture turned out to be a good solution. We defined three different levels:
Client software
Item middleware
Platform dependent daemons
To monitor specific systems you must be connected to the network; actually, you have to connect to the middle-tier Java server. Client side presents just a GUI (Graphical User Interface). Since it is written in Java, a Java capable browser is all you need. After you make a connection to the Java server, the GUI code is transferred to your local machine. Code is then interpreted with the Java built-in interpreter (if you use Netscape, for example).
The central point of our system is the middle-tier Java server. It not only holds Java classes to be transferred to the local clients, but it also takes care of the monitoring. The Java server is a program that runs all the time but demands only a few system resources. It connects to monitored computers and asks them for new data. Communication is handled via sockets and is very simple. We also introduced a very simple protocol for data transfer.
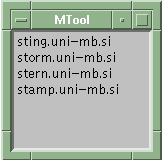
On the client side, one must run a starting applet to bring up the basic window in which all the computers to be monitored are listed (see Figure 2). Once we choose a computer's name from the list, a second window appears containing all the information about the observed system. We used a tabbed panel to display different types of data. We've chosen a tabbed panel to ease the upgrade procedure. If we add new system information, there is no problem with the graphical interface—we simply add a new panel.
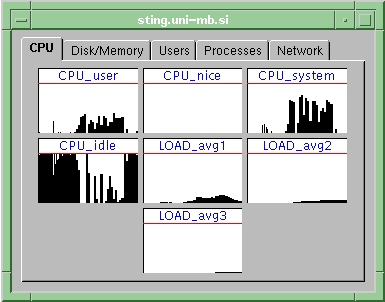
At this time we can provide the following system resources:
CPU information (user, nice, idle, sys, average)
Disk and memory information (free, used, swap)
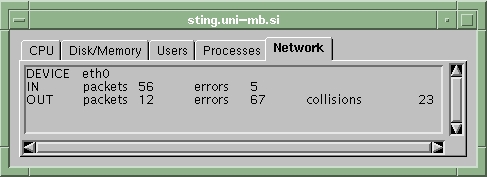
Network traffic
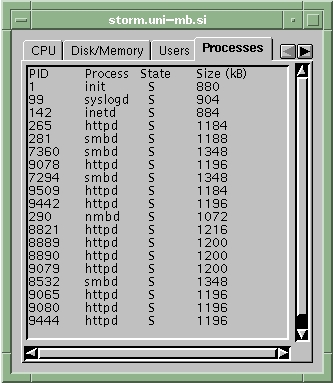
Processes
User connections
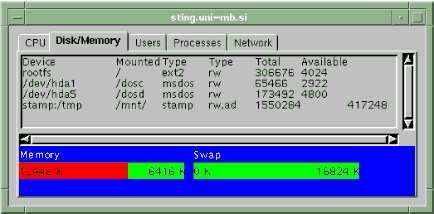
Figure 4. Disk Information and Memory Usage Panel
Figure 5. Network Transport Panel
The Java server is designed to run on an independent computer, but it can also run on a client of one of the monitored computers. The communication with the monitored computers via sockets is quite short and lasts only as long as the data transfer. At any time we can choose how often the Java server requests system resource data. At that time, a “ping” is sent to all monitored computers. At the ping, mtoold is awakened by inetd. Then mtoold reads system resource information and forwards that information to the middle-tier Java server. After completion the mtoold daemon “sleeps” until the next server's ping. The platform-dependent mtoold therefore uses system resources for only a very short time.
For its operation, the Java server is supported by one configuration file, named MTool.conf. The first part of this file contains the list of computers to be monitored, then the time between monitoring intervals, and last the list of client computers authorized to communicate with the Java server and thus monitor selected computer systems. We can use IP addresses or IP host names or both. As you can see from the sample configuration file below, one can also use the asterisk wild card in defining the domain name or the subnetwork address.
# First, the hosts to be moni-
# tored
cebelica.uni-mb.si
mravljica.uni-mb.si
cmrlj.uni-mb.si
strela.fcs.uni-mb.si
grom.uni-mb.si
164.8.253.16
# Second, monitoring time inter-
# val in seconds
4
# Last, clients with access to
# monitored hosts
*.hermes.si
130.216.54.51
164.8.253.99
130.15.40.*
193.246.15.*
164.8.253.*
The daemon mtoold is written in ANSI C and is platform-dependent. With Linux we use the /proc file system for CPU, memory and network information. Sun and HP do not provide such an elegant approach; on these platforms we have to use /dev/kmem files.
We have defined a protocol for socket communication. Information is transferred as an ASCII stream concatenated from reserved words such as GRAPH, VALUE, disk, user, process etc. and specific values separated with the character | as a delimiter. In this way, we can add a new observed parameter without difficulty. A sample stream looks like this:
GRAPH|LOAD_avg1|0.06|GRAPH|LOAD_avg2|0.12|GRAPH|
LOAD_avg3|0.22|GRAPH|CPU_user|1.00|GRAPH|CPU_nice|
0.00|GRAPH|CPU_system|0.00|GRAPH|CPU_idle|99.00|
VALUE|MEM_real|14652K|VALUE|MEM_free|252K|VALUE|
MEM_swap|33260K|VALUE|MEM_swap_free|31620K|
At this time, it is possible to intercept data transferred over the network; therefore, we are preparing Java encryption classes to enable secure data transfer. We are currently evaluating the DES and RSA algorithms. RSA would serve for key exchange (public and private) while DES, which is faster, would serve for the data transfer.
mtoold uses one simple configuration file which holds the names of the processes to be monitored. If this file is empty, information about all processes currently running on a monitored computer are transferred over the socket communication line.
Actually, at this time, we are not finished. The current version of MTool is just an intermediate step towards a more sophisticated and usable tool; however, it still provides a comfortable way of system monitoring. If we are authorized, we can monitor selected systems from any place in the world—a Java-capable browser is the only necessity. MTool is a small, powerful tool with many benefits. While using Linux as a development environment was a good choice, we would still like to appeal to the (non)commercial software companies to provide more Java development tools under Linux. Linux and Java together represent a competitive, reliable and cheap development system.


