
Performance Monitoring Tools for Linux
For the last few years, I have been supporting users on various flavors of UNIX systems and have found the System Accounting Reports data invaluable for performance analysis. When I began using Linux for my personal workstation, the lack of a similar performance data collection and reporting tool set was a real problem. It's hard to get management to upgrade your system when you have no data to back up your claims of “I need more POWER!”. Thus, I started looking for a package to get the information I needed, and found out there wasn't any. I fell back on the last resort—I wrote my own, using as many existing tools as possible. I came up with scripts that collect data and display it graphically in an X11 window or hard copy.
To get a good idea of how a system is performing, watch key system resources over a period of time to see how their usage and availability changes depending upon what's running on the system. The following categories of system resources are ones I wished to track.
CPU Utilization: The central processing unit, as viewed from Linux, is always in one of the following states:
idle: available for work, waiting
user: high-level functions, data movement, math, etc.
system: performing kernel functions, I/O and other hardware interaction
nice: like user, a job with low priority will yield the CPU to another task with a higher priority
By noting the percentage of time spent in each state, we can discover overloading of one state or another. Too much idle means nothing is being done; too much system time indicates a need for faster I/O or additional devices to spread the load. Each system will have its own profile when running its workload, and by watching these numbers over time, we can determine what's normal for that system. Once a baseline is established, we can easily detect changes in the profile.
Interrupts: Most I/O devices use interrupts to signal the CPU when there is work for it to do. For example, SCSI controllers will raise an interrupt to signal that a requested disk block has been read and is available in memory. A serial port with a mouse on it will generate an interrupt each time a button is pressed/released or when the mouse is moved. Watching the count of each interrupt can give you a rough idea of how much load the associated device is handling.
Context Switching: Time slicing is the term often used to describe how computers can appear to be doing multiple jobs at once. Each task is given control of the system for a certain “slice” of time, and when that time is up, the system saves the state of the running process and gives control of the system to another process, making sure that the necessary resources are available. This administrative process is called context switching. In some operating systems, the cost of this switching can be fairly expensive, sometimes using more resources than the processes it is switching. Linux is very good in this respect, but by watching the amount of this activity, you will learn to recognize when a system has a lot of tasks actively consuming resources.
Memory: When many processes are running and using up available memory, the system will slow down as processes get paged or swapped out to make room for other processes to run. When the time slice is exhausted, that task may have to be written out to the paging device to make way for the next process. Memory-utilization graphs help point out memory problems.
Paging: As mentioned above, when available memory begins to get scarce, the virtual memory system will start writing pages of real memory out to the swap device, freeing up space for active processes. Disk drives are fast, but when paging gets beyond a certain point, the system can spend all of its time shuttling pages in and out. Paging on a Linux system can also be increased by the loading of programs, as Linux “demand pages” each portion of an executable as needed.
Swapping: Swapping is much like paging. However, it migrates entire process images, consisting of many pages of memory, from real memory to the swap devices rather than the usual page-by-page mechanism normally used for paging.
Disk I/O: Linux keeps statistics on the first four disks; total I/O, reads, writes, block reads and block writes. These numbers can show uneven loading of multiple disks and show the balance of reads versus writes.
Network I/O: Network I/O can be used to diagnose problems and examine loading of the network interface(s). The statistics show traffic in and out, collisions, and errors encountered in both directions.
These charts can also help in the following instances:
The system is running jobs you aren't aware of during hours when you are not present.
Someone is logging on or remotely running commands on the system without your knowledge.
This sort of information will often show up as a spike in the charts at times when the system should have been idle. Sudden increases in activity can also be due to jobs run by crontab.
The file /proc/stat contains current counters for most of the data I wanted, and it is in a readable format. In order to keep the collector script as quick and simple as possible, I saved the data in a readable format rather than as binary data.
Breaking down and reorganizing the data for storage was a good job for awk, writing the data out to different files depending on the type of data. The /proc files are formatted nicely for this; each record has an identifying name in the first field. Here's a sample of /proc/stat from my 486 system:
cpu 1228835 394 629667 23922418
disk 43056 111530 0 0
disk_rio 18701 20505 0 0
disk_wio 24355 91025 0 0
disk_rblk 37408 40690 0 0
disk_wblk 48710 182050 0 0
page 94533 204827
swap 1 0
intr 27433973 25781314 58961 0 1059544 368102 1 2\
0 0 0 11133 154916 0 0 0 0
ctxt 18176677
btime 863065361
processes 18180
I dug into the kernel source for the /proc file system to figure out what the various fields were, as the man pages seem to date back to 1.x.
cpu: contains the following information: jiffies (1/100 of a second) spent in user/nice/system/idle states. I wasn't too concerned about the actual measurement, as I was just planning on looking at each state as a percentage of the total.
disk: summarizes all I/O to each of the four disks, while disk_rio, disk_wio, disk_rblk and disk_wblk break down the total into read, write, blocks read and blocks written.
page: page in and out counters
swap: counts of pages swapped in and out. The swap data in /proc/meminfo is expressed as total pages, used and free. Combine both sets of data to get a clear picture of swap activity.
intr: total interrupts since boot time, followed by counts for each interrupt.
ctxt: the number of context switches since boot time. This counts the number of times one process was “put to sleep” and another was “awakened”.
btime: I haven't found much use for this—it is the number of seconds after January 1, 1970 that the system was booted.
processes: the most recent process identification number. This is a good way to see how many processes have been spawned since the last check, so by subtracting the old value from the current one and dividing by the time difference (in seconds) between the two observations, the number of new processes per second is known and can be used to measure how busy the system is.
The lines we want here are the ethx and pppx records. In the collector script, the data is written out to a file using the full interface name. This way, the script is generalized for most any configuration.
Memory utilization can be tracked in the /proc/meminfo file as shown in Table 2.
The memory counters are expressed twice in this file, so we need to save only the Mem: and Swap: records to get the whole picture. The script matches the keywords at the start of the line and writes the data out to individual files rather than to one large database to allow more flexibility as new fields or data types are added. This makes for a cluttered directory but simpler script writing.
The script that collects the data is shown in Listing 1. Here are some things that are going on in a few key parts, plus comments:
Line 13: move to the directory where the data is to be stored using cd.
Line 14: get the timestamp for the data records in format HHMM.
Line 15: get the date for the output data file names in format MonDD.YY
Lines 19 - 25: select the memory and swap counter lines from /proc/meminfo and write the timestamp and data portion of the record to Mem.MonDD.YY and Swap.MonDD.YY.
Lines 29 - 36: extract the counters for any network interfaces from /proc/net/dev and write them out to files including the interface numbers, i.e., eth0 data is written out to eth0.MonDD.YY.
Lines 39 - 79: clip counters for cpu, disk, paging, swap page usage, interrupts, context switching and process numbers from /proc/stat and write them out to appropriate files.
The following line in my crontab file runs the collection script every five minutes every hour of every day:
0,5,10,15,20,25,30,35,40,45,50,55 * * * *\
/var/log/sar/sa 0 0 * * * exec /usr/bin/find\
/var/log/sar/data/ -mtime +14
-exec /bin/rm -f {} \;
The data accumulates over the course of the day to provide the data
points for analysis. A cleanup script invoked by the second line
removes each file after two weeks to keep the disk space
requirements down. A possible enhancement might be to compress each
file after it is complete, but space hasn't been much of an issue
yet.
I now had the data, but since columns of figures are boring, I needed a way to look at the data and make sense of it. I had used gnuplot for similar tools on other systems, so it seemed to be a good choice. I started with a script to display CPU utilization, charting the percentages of time spent in idle, user, system and nice states.
The cpu data file has five columns that look like this:
0000 4690259 69915 661038 7937582
0005 4690408 69964 661286 7966975
Column 1: seconds in idle state since last bootedColumn 2: seconds in system state since last bootedColumn 3: seconds in nice state since last bootedColumn 4: seconds in user state since last bootedColumn 5: time-stamp of observation (HHMM)
My reporting scheme was to get the amount of seconds spent in each state since the last observation, add up the different states and express each one as a percentage of the total. I ran into an interesting issue right away—what about a reboot? Booting the system zeroes out the counters and subtracting the old from the new generates negative values, so I had to handle it properly to provide useful information. I decided to watch for a counter value that was lower than the last observation's value and, if found, reset the prior values to zero. To make the chart more informative, a data point was set to 100 for a reboot and -1 for a normal record. The -1 value causes the data point to be outside the chart and thus not displayed.
Sometimes a hard copy is preferred when presentations or reports are needed. The gnuplot authors provide for a variety of output formats, and the script will switch between X11 display and PostScript output depending upon which option switches are set.
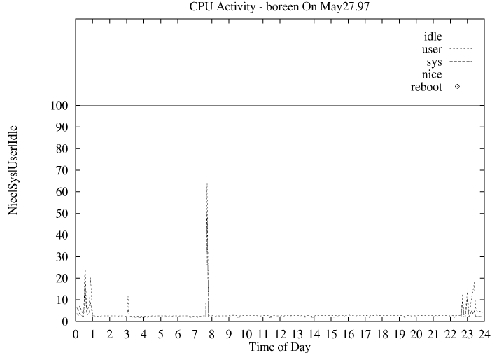
Figure 1. Sample Chart
Figure 1 is a sample chart produced by the graphing script shown in Listing 2. A breakdown of the major parts of this script is included in the archive file on SSC's FTP site, ftp.linuxjournal.com/pub/lj/listings/issue56/2396.tgz. Also included are the collection script, graphing scripts, a sample crontab entry for running the collector script and the following charting scripts:
cpu: charting cpu information as described above
ctxt: charting context switching per second
disk: disk utilization: total I/O, read/writes and block read/writes per second
eth: Ethernet packets sent and received per second and both incoming and outgoing errors
intr: interrupts by interrupt number and charted per second
mem: memory utilization and buffer/cache/shared memory allocations
page: page in and out activity
ppp: Point-to-Point Protocol packets sent/received per second and errors
proc: new process creation per second
swap: swap activity and swap space availability
I'm currently converting this toolkit to Perl and building a web interface to allow these charts to be viewed as HTML pages with the charts as GIF files.
All listings referred to in this article are available by anonymous download in the file ftp.linuxjournal.com/pub/lj/listings/issue56/2396.tgz.


