
Find Yourself with the Google Maps API
I don't think a day goes by that I don't use Google to find something, and lately, I've seen an increasing number of businesses that post Google maps to their locations on their Web sites. Sometimes, these companies even go so far as to put little push-pins on the map indicating each of their locations, which makes things very convenient for navigationally challenged people like myself.
I guess it would be possible to take a screenshot of a Google map and post it on a company Web site. I also guess you could open that image up in the GIMP and manually add a bunch of push-pins. Additionally, I guess you could use an image map to make the push-pins clickable and interactive. Yes, you could do things this way, and in a pinch, it might make sense, but it sure wouldn't be as much fun as using the Google Maps API and doing it right.
With the Google Maps API, you can create a map centered at a particular location. You can place colored push pins anywhere on the map, and you can draw geometric shapes on the map. Perhaps you even want to draw borders around delivery regions or school districts. The Google Maps API is incredibly powerful, and I've scratched the only surface myself.
However, before you can get started, you need to get an API key by registering with Google. This registration is free, and you receive your key instantly. You do, however, have to agree to some usage restrictions. Most of the restrictions seem reasonable. The only surprise is the Web site that uses the Google Maps API must be publicly accessible; it can't be on an intranet nor can it be password-protected. If you need to create an application that will not be publicly accessible, you can make other arrangements with Google. To sign up for a key, point a browser at code.google.com/apis/maps/signup.html. You will be asked for your Web site's domain name, and you'll need a separate key for each domain.
Once you've got an API key, you're ready to start coding. First, you need to create a simple Web page to display your map (Listing 1).
Listing 1. HTML for Google Map
1 <html>
2 <head>
3 <title>My Google Map</title>
4
5 <style>
6 #map {
7 position: relative;
8 left: 5px;
9 top: 5px;
10 width: 764px;
11 height: 520px;
12 }
13 </style>
14
15 <script src="http://maps.google.com/
↪maps?file=api&v=3&key=thisisasecret&sensor=false"
16 type="text/javascript">
17 </script>
18
19 <script type="text/javascript" src="/main.js"></script>
20
21 </head>
22
23 <body onload="initialize('map');" onunload="GUnload();">
24
25 <div id=map>
26 Map goes here.
27 </div>
28
29 <p>
30
31 SW Corner: <span id=debug_sw> </span><br>
32 NE Corner: <span id=debug_ne> </span><br>
33 Zoom: <span id=debug_zoom> </span><br>
34
35 </body>
36 </html>
Lines 1–14 are simple boilerplate HTML. Note that I include some in-line styling for a div container called “map”. Here I'm mostly just interested in setting the size of the resulting rectangle.
Lines 15–17 are where you load the Google Maps API. The section of the URI that looks like “v=3” indicates that I'm using version 3 of the API. This is also where you include the API key you obtained earlier. Finally, you see the “sensor=false” section of the URI. This indicates that I'm not using any type of location sensor, such as a GPS, to select the appropriate map. Accurately configuring this field is required by the Google Maps API EULA.
The JavaScript program that I wrote to load and manipulate the map is loaded on line 19. On line 23, I arrange for an initialization function that I wrote to be called when the page finishes loading and another function, that Google provides, when I close the page. I discuss the initialize() function shortly.
The rest of the HTML simply creates a container (mentioned earlier) to hold the map and a few other containers to hold debugging information. You might not want to display this information in a production application, but it's instructional to see what type of information is available from the API and what methods are available to the programmer for keeping the display up to date as the user interacts with the map.
The rest of the map is created in JavaScript, so let's take a look at Listing 2.
Listing 2. JavaScript for Google Map
1 var map;
2 var default_map = "35.181804,-105.40625,8";
3
4 function initialize (el) {
5 if (!GBrowserIsCompatible()) {
6 document.getElementById(el).innerHTML = "Incompatible Browser";
7 return;
8 }
9
10 map = new GMap2(document.getElementById("map"));
11
12 var l = default_map.split(",");
13 map.setCenter(new GLatLng(parseFloat(l[0]), parseFloat(l[1]))
↪,parseInt(l[2]));
14 update_gui();
15
16 map.addControl(new GMapTypeControl());
17 map.addControl(new GSmallMapControl());
18 map.setMapType(G_HYBRID_MAP);
19
20 GEvent.addListener(map, "mousemove", function () {update_gui();});
21
22 ajax_get("/markers.xml", "parse_markers");
23
24 ajax_get("/zones.xml", "parse_zones");
25
26 update_gui();
27 }
28
29 function parse_markers (e) {
30 var i, lon, lat;
31 var assets = e.getElementsByTagName("asset");
32
33 for (i=0; i<assets.length; i++) {
34 lon = parseFloat(assets[i].getAttribute("long"));
35 lat = parseFloat(assets[i].getAttribute("lat"));
36
37 var marker = new GMarker(new GLatLng(lat,lon));
38
39 marker.id = assets[i].getAttribute("id");
40 marker.name = assets[i].getAttribute("name");
41 marker.desc = assets[i].getAttribute("desc");
42
43 marker.long = lon;
44 marker.lat = lat;
45
46 map.addOverlay(marker);
47
48 //GEvent.addListener(marker, "mouseover", function ()
 ↪{marker_mouseover(this);});
49 GEvent.addListener(marker, "click", function ()
 ↪{marker_click(this);});
50 }
51 }
52
53 function parse_zones (e) {
54 var i,j;
55 var containers = e.getElementsByTagName("container");
56
57 for (i=0; i<containers.length; i++) {
58 var bounds = new Array;
59
60 var id = containers[i].getAttribute("id");
61 var name = containers[i].getAttribute("name");
62 var desc = containers[i].getAttribute("description");
63
64 var points = containers[i].getElementsByTagName("point");
65 for (j=0; j<points.length; j++) {
66 var p = new Object;
67
68 p.long = points[j].getAttribute("long");
69 p.lat = points[j].getAttribute("lat");
70
71 bounds.push(new GLatLng(p.lat,p.long));
72 }
73
74 var container = new GPolygon(bounds, "#ff0000",
 ↪5, .5, "00ff00", .2);
75
76 container.id = id;
77 container.name= name;
78 container.desc = desc;
79
80 map.addOverlay(container);
81 GEvent.addListener(container, "click", function ()
 ↪{zone_click(this);});
82
83 }
84 }
85
86 function marker_mouseover(who) {
87 map.openInfoWindow(new GlatLng(who.lat,who.long), who.name);
88 }
89
90 function marker_click(who) {
91 map.openInfoWindow(new GLatLng(who.lat,who.long), who.desc);
92 }
93
94 function zone_click(who) {
95 map.openInfoWindow(new GLatLng(who.lat,who.long), who.desc);
96 }
97
98 function update_gui () {
99 var sw = map.getBounds().getSouthWest();
100 var ne = map.getBounds().getNorthEast();
101
102 document.getElementById("debug_sw").innerHTML= sw.toString();
103 document.getElementById("debug_ne").innerHTML= ne.toString();
104 document.getElementById("debug_zoom").innerHTML= map.getZoom();
105 }
In lines 1 and 2, I create a global variable to hold the “map” object that the API will create. I also configure the latitude and longitude to point the map.
The initialize() function is found in lines 4–27 and does all the work of creating the map. In lines 5–10, I test to make sure that the user's Web client is able to display the map, and if so, I create the map object. Lines 12–18 configure the map. First, I select the location for the map to display. Then, I add the map type and map navigation controls. The map type control allows the user to select between a simple map, satellite map or hybrid map. The map navigation control allows the user to pan the map around and to zoom in and out. Finally, I configure the map to display as the hybrid map by default.
The update_gui() function referred to on lines 14, 20 and 26 simply updates the debugging information below the map and probably wouldn't be used in a production application. Line 20 is interesting because it demonstrates how to have your application react when the user scrolls or zooms the map to other locations. In this case, the application simply updates the lat/long coordinates below the map. I discuss the update_gui() function a bit more later.
At this point, if you did nothing else, you'd have a map that users could interact with. They'd be able to select the type of map, move it around and zoom in and out. But, let's go a bit further.
The ajax_get() function called on lines 22 and 24 isn't included in Listing 2, but it's relatively easy to write. This function simply accepts a URL and the name of a JavaScript function as parameters. Then, the function makes an AJAX call and fetches the data at the given URL. This data is assumed to be XML, which is passed to the indicated function.
The parse_markers() function referenced on line 22 accepts an XML string that describes where to put markers on the map. This XML resembles Listing 3. As you can see, it's simply a list of assets; each asset has an ID, a name, a description and a lat/long location.
Listing 3. XML Listing of Markers
<assets>
<asset id="1" name="Home" desc="The home base" lat="35"
 ↪long="-105"></asset>
<asset id="2" name="BC Site" desc="The off-site site"
 ↪lat="34" long="-106"></asset>
</assets>
The parse_zones() function on line 24 of Listing 2 works similarly and describes shapes to be drawn on the map. The corresponding XML looks like that shown in Listing 4.
Listing 4. XML Listing of Zones
<containers>
<container id="1" name="HQ" description="This is HeadQuarters">
<point lat="35.0" long="-105.0" />
<point lat="35.0" long="-106.0" />
<point lat="36.0" long="-106.0" />
<point lat="35.0" long="-105.0" />
</container>
<container id="2" name="OffSite"
 ↪description="This is the Offsite Site">
<point lat="37.0" long="-104.0" />
<point lat="37.0" long="-105.0" />
<point lat="38.0" long="-105.0" />
<point lat="37.0" long="-104.0" />
</container>
</containers>
Here, you see two containers and a list of lat/long points that define their boundaries. So, with what you have so far, and some slightly different data, you get a map that resembles Figure 1. By default, the map centers on a location just outside of Albuquerque, New Mexico. You see a red triangle that's filled in with green. The triangle is semi-transparent, so you can see the map through it. You also see one of the markers in the lower-right corner of the triangle. In Figure 1, I've clicked on the marker to demonstrate the information window, which I discuss a bit more later.
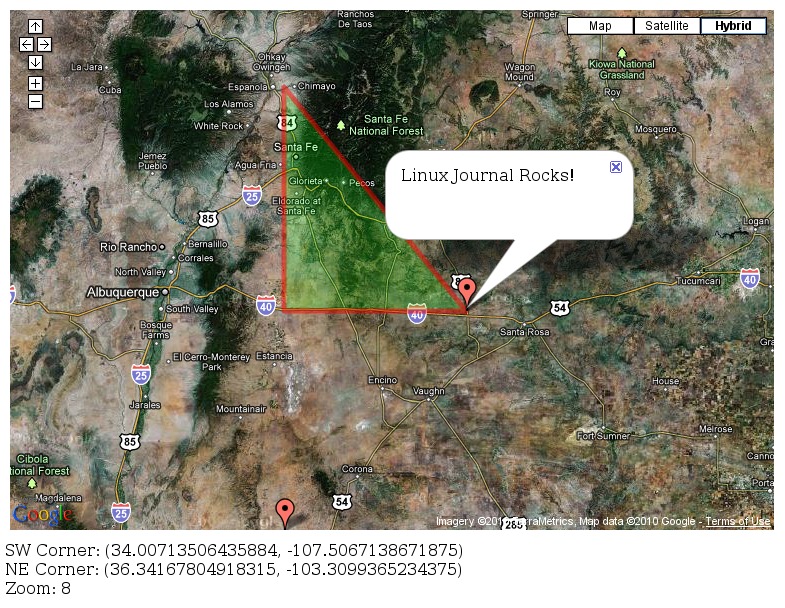
Figure 1. Final Results
Let's take a closer look at the parse_markers() function defined on lines 29–51 of Listing 2. This function is fairly straightforward and simply loops over a list of assets. For each asset, the function parses the lat/long coordinates of the marker and creates a marker object with them (lines 34–37). Notice on line 37 that I had to use the lat and long variables to create an object to pass to the marker constructor. Next, I set some additional attributes for each marker for later use. Then, on line 46, I added the marker to the map. Lines 48 and 49 are interesting—they allow users to click on (or mouse over) a marker and display additional information. I've commented one of the lines out because it doesn't seem to work well to have a mouse-over and mouse-click event at the same time. I probably need some additional logic, but you get the idea.
The parse_zones() function is only slightly more complex, because it has to build a GPolygon object from the points listed for each container. Lines 53–62 are similar to the first part of the parse_marker() function. The main difference is in lines 64–72 where I loop over each point that delineates the zone, create a GLatLng object for each point and push the object onto the bounds array. Then, on line 74, I create a GPolygon object with this array of points. The GPolygon constructor also allows you to specify a border color and size, as well as a fill color and opacity setting. I add the polygon to the map on line 80. I add an on-click event handler on line 81, so that when users click on a given zone, the application can perhaps provide more information about the zone.
The event handlers defined on lines 86–96 are almost identical and quite trivial, so let me make some passing comments about them all at once. They each call the map object's openInfoWindow method to open the little message bubble and display a message. In these cases, I simply display the name or description of the object the user clicks on. In a real-world application, you might use the id attribute to make an AJAX callback to a server-side database and do some really cool things.
Finally, the update_gui() function on lines 98–105 is responsible for updating some of the display information at the bottom of the map. To do this, the function uses some of the map object's methods to get the coordinates of the southwest and northeast corners of the map. Then, those coordinates are converted to strings and placed inside the appropriate container on the Web page. The map's zoom factor is handled very similarly.
As you can see, using the Google Maps API is pretty easy. The API is fairly intuitive and exhaustively documented at Google. As I mentioned in the beginning of this article, it's pretty easy to plot businesses' office locations or the locations of their customers. But, this is the Web, and it should be fun. How about a geography quiz game with real maps? Or a Risk-like game, or any number of military simulations set on a virtual Earth? I recall playing a racing game that allowed you to drive a car around a Google Map. The Google Maps API is simple and powerful, and lots of interesting things are waiting to be done with it.
Mike Diehl is a contract programmer and consultant in Albuquerque, New Mexico. Mike lives with his wife and three small boys and can be reached via e-mail at mdiehl@diehlnet.com.

