
New Projects - Fresh from the Labs
If statistics is your game, and you're chasing an easy-to-use and comprehensive package that outputs great-looking charts, look no further. According to the Web site: “SOFA is a user-friendly statistics, analysis and reporting program. It is free, with an emphasis on ease of use, learn as you go and beautiful output. SOFA lets you display results in an attractive format ready to share.”
SOFA Statistics provides a highly flexible visualization system for analyzing complex data.
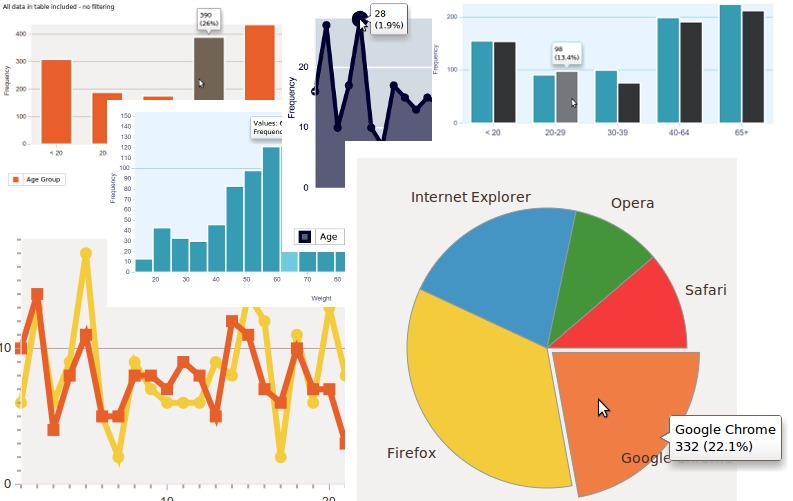
A montage of some of SOFA's beautiful graphs and charts, generated on the fly.
My favorite feature of SOFA's is its ability to generate HTML pages of your work dynamically, which can be viewed by anyone with a browser.
Installation
Binary packages are available for Linux, Windows and Mac (with Linux at the top of the list). Sadly, the Linux binary is only for Ubuntu, but the obligatory source also is available. Ubuntu users can grab the .deb and work things out for themselves, but the source is a bit trickier. At the time of this writing, the installation process was in a state of flux, so project maintainer Grant Paton-Simpson will have some special instructions up at the Web site for LJ readers when this article is printed.
As far as library requirements, here's what Grant told me you need:
python (>= 2.6.2).
wx-common (>= 2.8.9.2).
python-wxversion (>= 2.8.9.2).
python-wxgtk2.8 (>= 2.8.9.2).
python-numpy (>= 1:1.2.1).
python-pysqlite2 (>= 1.0.1).
python-mysqldb (>= 1.2.2).
python-pygresql (>= 1:4.0).
python-matplotlib (>= 0.98.5.2).
python-webkit (>= 1.0.0).
Once the program is installed, you should be able to find SOFA Statistics in your menu; otherwise, you'll need to run it from a terminal. If you need to use the command line, enter:
$ python /usr/share/pyshared/sofa/start.py
This path may be different on some distributions, and Grant may have made a link to a bin directory by the time this article is published (meaning you could start SOFA Statistics with a simple one-word command).
Usage
Grant has gone to a lot of effort making some excellent video tutorials, and there's no way I can improve upon them, so instead, I concentrate on highlighting cool features here. Again, Grant appears to be one step ahead of me in that he's provided a default set of preloaded values you can use to explore the project with ease, rather than going through the laborious process of first having to learn how to enter data and then making it display something meaningful. For now, let's look at the three main sections: Report Tables, Charts and Statistics.
Under Report Tables, choose some random settings under Table Type, provide names for Title and Subtitle, and choose some of the available data fields with the Add button. Now click Run, and a swank new table is presented to you. Don't like the aesthetics? No problem. The Style output using... drop-down box lets you change the border to something more pleasing—a nice touch.
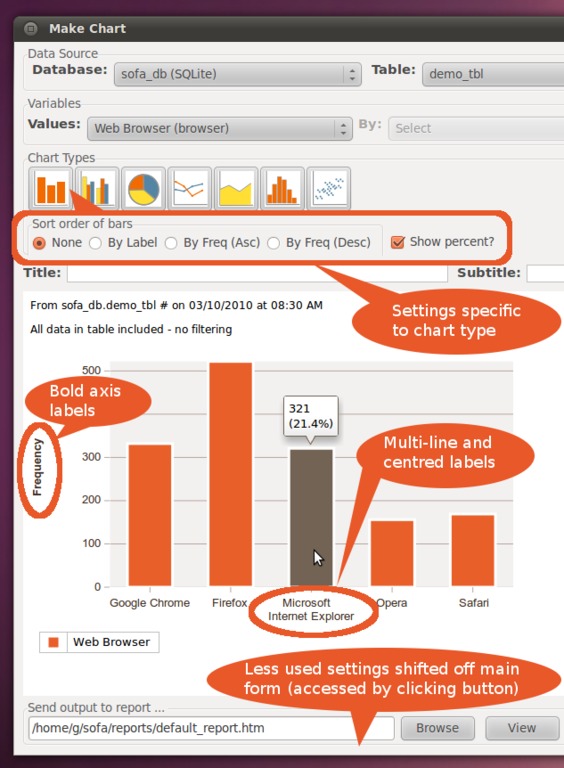
The pièce de résistance is probably the Charts section. This is where you can play around with the charts you see here in the screenshots, and more and more chart types are being added over time. Whether you want a bar graph, pie chart, line graph or something like a Scatterplot configuration, chances are it's doable. Play with some values in the Variables section, choose a Chart Type, click Run and a beautiful chart appears.
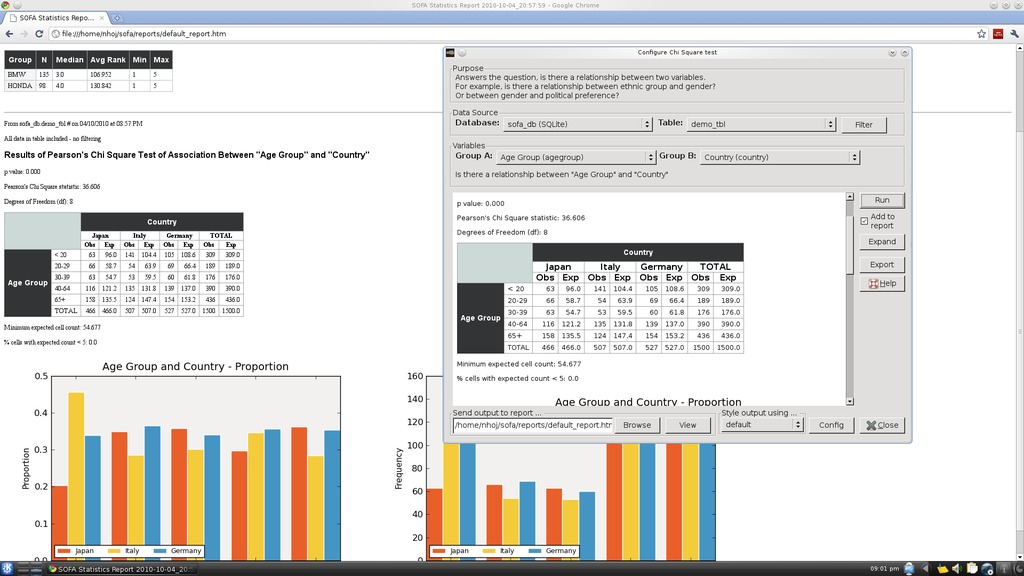
The Statistics section is where the elegance of design and data flow really come into play. This section is a bit beyond me, but here you can run statistical tests on your data, with a focus on the kind of tests most users need, most of the time. You can choose from common tests, such as ANOVA or Chi Square, or run through a check list of choices to choose what's right for you. Click Configure Test on the right, and you'll be presented with the final screen.
From here, you can choose which variables and groupings you want to test against. And finally, click Run. This section gives you the most impressive of the readouts and provides a comprehensive bundle of tables and graphs of analyzed statistics.
However, one of the most impressive and practical features under all three of these main sections is the Send output to... feature, with its View button. Here you actually can view each page of output in any Web browser in HTML format. This gives the project some instant credibility and practicality in that any work you do in SOFA can be opened instantly by anyone (like your coworkers) on their own computers, without needing to install SOFA Statistics. Plus, the information they see will be presented professionally with some impressive graphics to boot.
Although SOFA Statistics is still in its slightly buggy developmental stage, project maintainer Grant Paton-Simpson has shown an impressive grasp of what needs to be included in SOFA, from the small touches to the big. My hope is that this program becomes an adopted industry standard of sorts, mentioned in everyday conversation by organization workers the world over. And, given its free and multiplatform nature, combined with a very canny coder and designer, this hope of mine may not be an unrealistic one.
Fans of unique puzzle games should check out Cube Escape—a really interesting variation on the traditional maze games you've come to expect. According to the Web site: “You are inside a cube made up of numerous shells, with a maze etched on the surface of each shell. Escape the cube by traveling through the mazes, including over cube edges, until you find an upward exit home. When you reach the red exit, you win.”
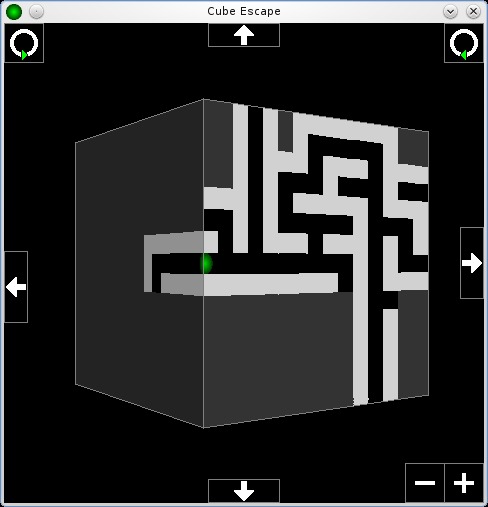
Cube Escape is a brain-melting maze game that takes place on a cube, where you escape from multiple layers in the process.

Later levels can become seriously complex, making 3-D navigation incredibly difficult.
Installation
Running this game actually is very easy, as you don't have to compile it (assuming you're on an Intel x86 architecture). If you're not on an Intel-based distro, fear not; compilation is also very easy. Although binaries are available at places such as playdeb.net (and you can work out how to install those yourself), the source tarball is so easy that I'll just run with that.
As far as library requirements go, the documentation says you need the following
SDL_ttf (www.libsdl.org/projects/SDL_ttf).
SDL_image (www.libsdl.org/projects/SDL_image).
Grab the latest tarball from the Web site and extract it. Open a terminal in the new folder, and if you're on an x86 machine (including AMD64 and the like), run the program with the following command:
$ ./cube-escape
If you're running on another architecture, simply delete the current cube-escape file and enter this command:
$ make
Now you can run the game with the same command as above.
Usage
Inside the game, the controls and game play are pretty simple. Start a new game, and using the default settings for now, click OK and the game starts.
You'll be presented with a small white box, with the player represented as a green ball inside a black pathway. Basic controls consist of the arrow keys for movement, and the Enter key engages the colored portals to ascend and descend between levels, as well as the red portals that finish the game.
At this point, I recommend right-clicking in the black space outside the maze. A set of controls appears (which can be disabled again by another right-click) that control your view of the cubic maze. Currently, you are looking at one side of the cube, but click any of the arrows on the top, bottom, left and right of the window, and you can flip the cube around, exploring all six sides of the cube before moving on. This is handy for checking which direction your needed portals are on, so I highly recommend you do so!
If you look in the corners of your game window, at the bottom right of the screen are some zoom controls. At the top left and top right are rotational controls, so you actually can rotate the view of the cube, instead of just changing between cube faces.
As far as the actual gameplay goes, you start on some very basic levels with little detail, zoomed in quite closely to your character. Find your way to the green portal, and you'll ascend to the next layer. At the top layer is the red portal to finish, and the blue portals let you descend layers (I'm not sure why you would though, unless other gameplay mechanics are in the pipeline).
You'll notice gray sections on the cube. These are the unexplored areas, and they light up and reveal bits of maze the more you explore, staying that way if you're heading back (the game would be very hard without this gameplay mechanic as you'd keep covering old ground).
Once you've come to grips with the game, you may want to increase the difficulty. When you start a new game, the Options screen has a number of variables you can change, such as how many levels you want, which level to start on, how far the exit distance is from the starting portal and so on.
Although the gameplay of Cube Escape will speak for itself with any genuine geek (myself included), OSS projects have a habit of evolving into something bigger, and what I'm really looking forward to are the mutations that inevitably will take place.
The game may take place on a 3-D cube, but most of the time, this 3-D world isn't readily apparent. If you turn off the Advanced Graphics option with its cube flipping, you would realize the game takes place on a cube only after hours of playing time. I know it's shallow, but if some whiz-kid OpenGL programmer used some perspective tricks to show something like a cube floating in space, with some graphical hints toward the game taking place over multiple layers, the appeal of the game would become readily apparent to any casual observer.
I think there's also some potential for modifications, such as a “time attack” mode, split-screen multiplayer races, or some kind of gameplay mechanic that would make use of the descent function, utilizing each level completely and multiple times (instead of just ascending).
I'm not criticizing the game though—far from it! I think this game has a solid design principle at heart that easily could be extended upon. Cube Escape may become one of those cult-following games that spawns a thousand variants. Get modding, people.
Brewing something fresh, innovative or mind-bending? Send e-mail to newprojects@linuxjournal.com.
John Knight is a 26-year-old, drumming- and climbing-obsessed maniac from the world's most isolated city—Perth, Western Australia. He can usually be found either buried in an Audacity screen or thrashing a kick-drum beyond recognition.

