
Kexi in Use
This article takes new users through a range of concepts in Kexi, the KOffice database management program. The features available in Kexi range from simple table and query creation to more-advanced reporting and scripting. Kexi recently was released as part of KOffice 2.2. This article is aimed at new users and existing users of Kexi 1.6 as a demonstration of how useful Kexi can be.
Kexi 2 has taken three years of development to get to this stage from Kexi 1.6, and it missed the releases of KOffice 2.0 and 2.1 due to the small number of developers. Like many open-source programs, Kexi is developed solely in developers' free time as a hobby. It is hoped that this first release now is stable enough for use and that it will provide something to build upon for future releases.
To be a useful guide, it's helpful to work on a real use case. As the owner of the Kexi Facebook page (see Resources), I get weekly updates via e-mail with various statistics. The aim of this article is to get this data out of these e-mail messages and into a Kexi database to be able to perform queries and reports to show trends over time.
To get the data for the database, I exported a selection of e-mail messages from KMail. This created a .mbox file, which basically is a text file containing all the messages. It would have been possible to go through each e-mail and enter the details into a table manually, but as I have a few built up already, I want to gather the data automatically. This provides a good challenge for writing a script within Kexi to do it for me.
If Kexi is not included in your installation, see if it is available as an update in your package manager. If not, you need to install it from source using the guides on the KOffice and KDE Wikis (see Resources).
Start by launching Kexi and selecting create a Blank Database from the startup wizard. Depending on the installed plugins, you will be able to create a database stored as a file or create a database on an existing database server, such as PostgreSQL or MySQL. Selecting to have it stored in a file is easiest for new users and is appropriate when there will be a limited number of users accessing the database at any one time. Kexi file-based databases use SQLite as the underlying format, so they are readable by any SQLite-compatible program.
The database requires a name (I chose kexi_facebook), followed by a location to save it. The default location is fine. After this, you are presented with the main Kexi window. The main window contains a toolbar along the top and a project navigator down the left-hand side. The main toolbar in Kexi is different from the other KOffice applications and uses a tab-style layout. Each opened window also has a local toolbar for options specific to that window, such as table, query, form, report and script.
From the Create tab across the top menu, choose Table to launch the table designer.
The statistics I receive via e-mail include the date, number of new fans, number of wall posts, number of visits and total fans, so I created a table with the design schema shown in Figure 1.
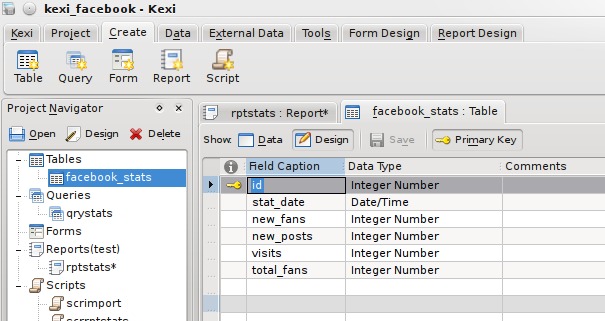
Figure 1. Table Design
The fields have a name, type and comment, and also several properties are available from the property editor on the right-hand side, such as constraints and a default value if none is given. Each object in the database will have numerous properties associated with it, and the property editor allows these to be displayed and edited in a single location.
Switching to Data view prompts you to save the table and show the table data editor allowing manual entry of records, but that's not much fun!
With my newly created but empty table, I needed to get the data automatically. As I mentioned earlier, the data was in a single .mbox file containing all e-mail messages. Kexi supports scripts, which can be written in ECMAScript (aka JavaScript), Python or a number of other languages supported by Kross, the KDE scripting framework. I chose to use the QTScript back end, which allows writing in JavaScript, as I am more familiar with it than Python.
My script had to open the .mbox file, read it line by line, grab the data it needed using string manipulation, and when a full set of data was read, add it as a record to the database. Scripts not only have access to built-in methods and Kexi-specific methods, but they also can import libraries containing large amounts of useful functions—the most useful being the Qt libraries. I use the Core functions to have access to the filesystem, using QTextStream for reading data, and the GUI functions for access to QMessageBox to present errors in a dialog if they occur.
From the Create menu tab, this time, I choose Script. This launches the script editor in the central window and the property editor down the right.
A script has only a few properties, the type and the interpreter. The interpreter I want is QTScript, and the type is Executable. An executable script is one that is meant to be run manually. A Module script is meant to contain generic modules of code, accessible from other scripts. And, an Object script is one that is tied to another database object, such as a report.
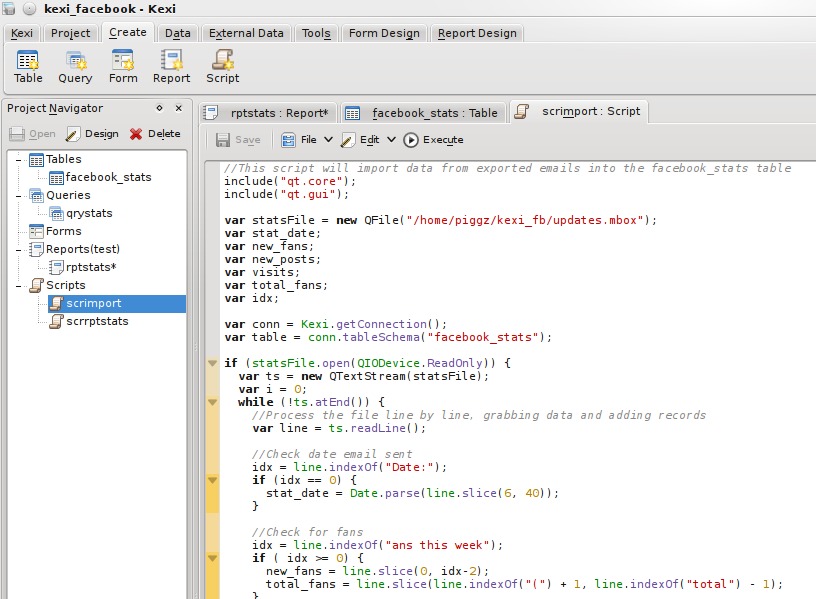
Figure 2. Script Design
The entire script is shown in Listing 1.
Listing 1. Facebook E-mail Import Script
// This script will import data from exported emails
// into the facebook_stats table
include("qt.core");
include("qt.gui");

var statsFile = new QFile("/home/piggz/kexi_fb/updates.mbox");
var stat_date;
var new_fans;
var new_posts;
var visits;
var total_fans;
var idx;

var conn = Kexi.getConnection();
var table = conn.tableSchema("facebook_stats");

if (statsFile.open(QIODevice.ReadOnly)) {
  var ts = new QTextStream(statsFile);
  var i = 0;
  while (!ts.atEnd()) {
    // Process the file line by line,
    // grabbing data and adding records
    var line = ts.readLine();

    // Check date email sent
    idx = line.indexOf("Date:");
    if (idx == 0) {
      stat_date = Date.parse(line.slice(6, 40));
    }

    // Check for fans
    idx = line.indexOf("ans this week");
    if ( idx >= 0) {
      new_fans = line.slice(0, idx-2);
      total_fans = line.slice(line.indexOf("(") + 1,
                              line.indexOf("total") - 1);
    }

    // Check for wall posts
    idx = line.indexOf("all posts");
    if (idx >= 0) {
      new_posts = line.slice(0, idx-2) + 0;
    }

    // Check for visits
    idx = line.indexOf("isits to your");
    if (idx >= 0) {
      visits = line.slice(0,idx-2);

      // Should have all the data now so insert a record

      stat_date = new Date(stat_date);
      var short_date = stat_date.getFullYear() + "-"
                     + pad(stat_date.getMonth() + 1, 2) + "-"
                     + pad(stat_date.getDate(), 2);

      if (!conn.insertRecord(table, [++i,
                                     short_date,
                                     new_fans,
                                     new_posts,
                                     visits,
                                     total_fans])) {
	    var msg = "Cannot insert into " + table.caption() + '\n';
	    msg += "Date: " + stat_date.toDateString()
	         + " " + short_date + '\n';
	    msg += "New Fans: " + new_fans + '\n';
	    msg += "Total Fans: " + total_fans + '\n';
	    msg += "New Posts: " + new_posts + '\n';
	    msg += "Visits: " + visits;

	    QMessageBox.information(0,"Error", msg);
      }
    }
  }
  QMessageBox.information(0, "Records Added:", i);
}

statsFile.close();

function pad(number, length) {
  var str = '' + number;
  while (str.length < length) {
    str = '0' + str;
  }
  return str;
}
A possible bug in the script shown in Listing 1 is that it assumes there are no current records in the table, and it creates primary keys starting at 1. It is okay to run the script once, but if it is run again, it tries to overwrite records that have an ID matching what it is trying to insert. To make it more robust, it first needs to find out the current maximum of the ID field (this would be a good exercise to get used to writing scripts).
When executed from the script toolbar, the script gathered 11 records worth of data, which is visible from the Table Data View (Figure 3).
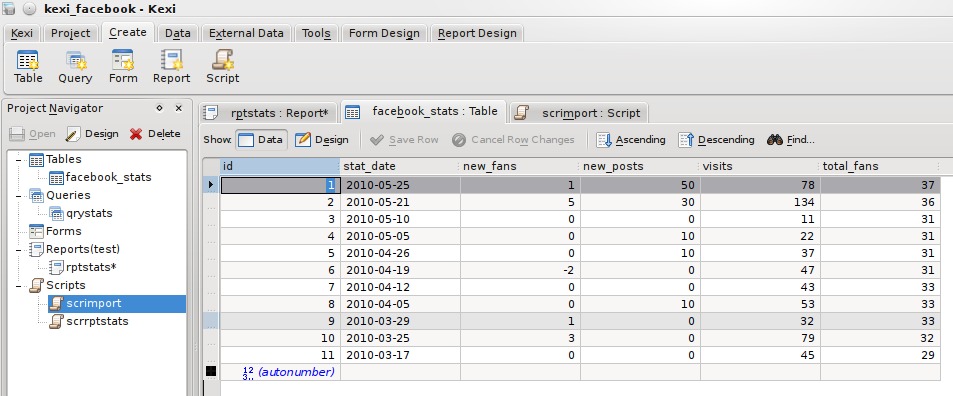
Figure 3. Table Data
It's worth pointing out that the above script took a lot of trial and error, as it is not initially obvious that it is possible to import extra libraries or use Kexi-specific functions. The documentation needs work to make this easier for new users, and submissions are very welcome at the KDE Userbase Web site.
At the moment, the data is ordered in the order in which it was extracted from KMail. Because I need it to be in ascending date order, I created a query to sort it. From the Create tab, this time I chose Query. I wanted all fields except the auto-incrementing primary key, so I set it up as shown in Figure 4.
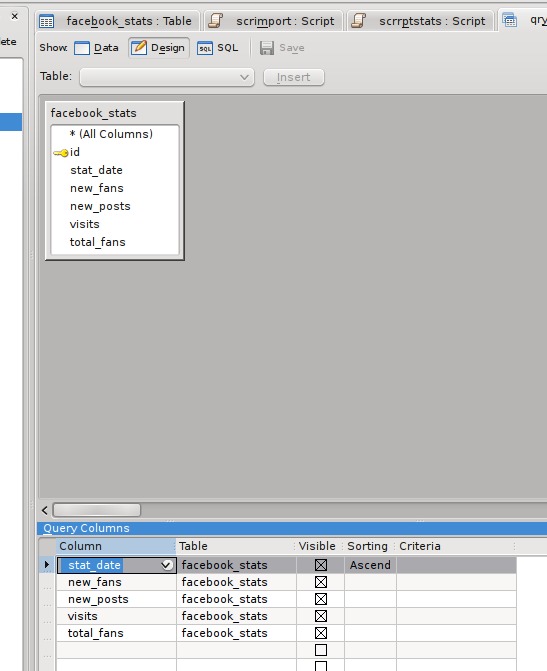
Figure 4. Query Design
Switching to Data View executes the query and displays the results (Figure 5).
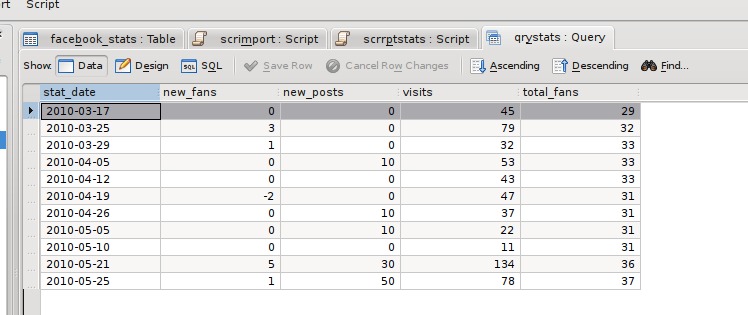
Figure 5. Query Data
I saved the query as qryStats for use in a report.
A new feature of Kexi 2 is the report plugin. This allows reports to be designed and executed directly within Kexi using a GUI editor similar to report designers in other database systems, such as Microsoft Access, Crystal Reports or Oracle Reports. In Kexi 1.6, reports were available as a separate add-on from kde-apps.org, but it did not contain as many features as the version in Kexi 2, and it was not fully integrated with the application, as the designer was an external program.
Reports can be printed, saved as a PDF, exported to HTML or OpenDocument Spreadsheet files or simply remain in the database for live viewing. It is possible to save the report in all these formats because of the two-stage generation process. Reports first are rendered into an intermediate description, and this description is used to generate the final version in whatever format is selected. In a future version, it is likely that extra formats will be supported, such as OpenDocument Text and XML, suitable for further processing using XSLT.
From the Create tab, I choose Report to create a blank report with a single “Detail” section. The structure of a report is based around Sections, which can be page headers or footers, report header or footer, or Group sections where data is grouped on a field value.
Initially, all I want is a simple tabular view of the data, so all the fields will go into the detail section, apart from a header, and the field titles, which must go either in a Page Header or Report Header. From the Section Editor on the report toolbar, I added a Report Header, and using the Report Design tab on the menu bar, I added fields and labels to create the report layout. From the Data Source tab on the sidebar, I set the reports data source to the qryStats query I created above. Finally, I set the Control Source property of each field item to the corresponding field in the query and the Caption of the labels appropriately. In the end, it looked like Figure 6, and it generated a report, shown in Figure 7.
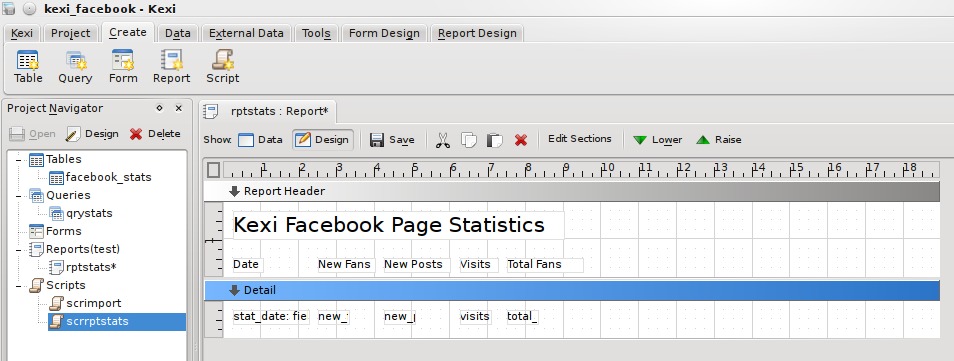
Figure 6. Report Design
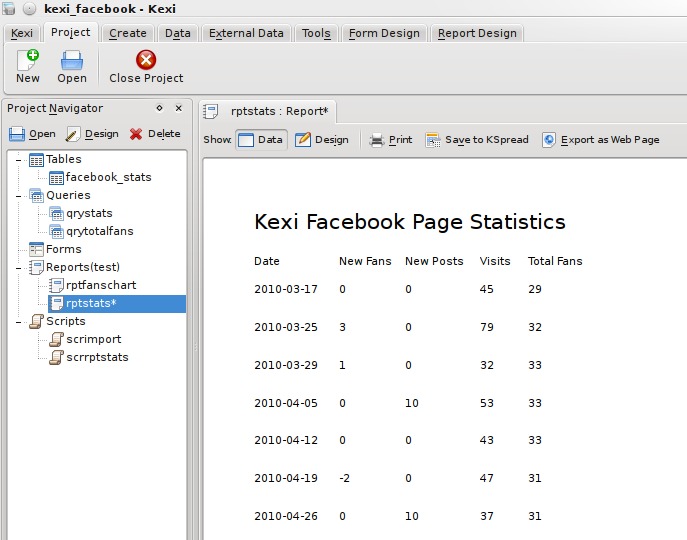
Figure 7. Plain Report
This gets the job done, but it isn't quite as “jazzed up” as I would like. It's common in desktop applications to alternate the background color of rows to make it more obvious where each set of data begins and ends, so let's try that.
I created another script, but this time set its type to Object, as it is to be associated with the report object. Report scripts are event-driven—that is, whenever a certain event occurs in the generation of the report, the associated code in the script is called. Report scripts use the features of Kross::Object, where each object in a report can be associated with a script object, making it more object-oriented in nature. Each script object can have its own variables and functions. Report objects can be the report itself or any of the report sections. To make it more clear, the final script looks like what's shown in Figure 8.
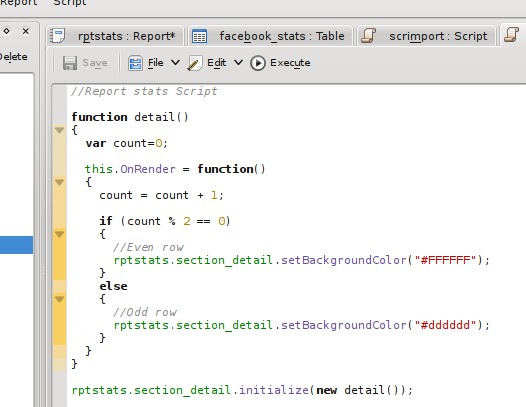
Figure 8. Statistics Script
This is quite a simple script. There is an object called detail, containing a function OnRender, which will be called whenever a detail section is rendered. The function keeps track of how many times it has been called and alternates the background color. The final line of the script associates the detail function with the detail section of the report.
Then, in the report, I set the Interpreter Type to QTScript and the Object Script property to the name of the script. It is important that the Interpreter type of both the report and script match; otherwise, the script won't be presented as an option in the Object Script list.
The generated report now looks like Figure 9.
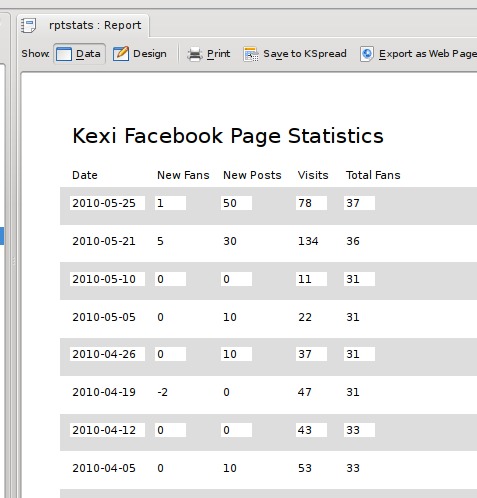
Figure 9. Tabular Report 1
It's not so great with the white background on the fields, so I went back to the designer and changed the Opacity property of each of the fields to 0 to make them transparent, resulting in a more reasonable report (Figure 10).
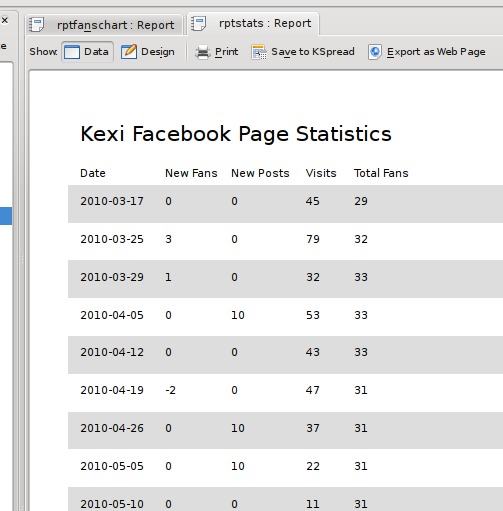
Figure 10. Tabular Report 2
My final requirement at this stage was to have something more graphical: a nice chart to show the trend of fans over time. The report designer allows the creation of charts using the KDChart library from KDAB and is used in the KOffice program KChart. It is quite powerful, allowing you to join chart data to the main report data (called master-child links), but for now, all I needed was a simple, single chart. The chart object expects data in a certain format. There must be two or more columns of data. The first column is used for the labels on the X axis, and all other columns are used as a series in the chart. I started by creating a query with two columns, date in ascending order and total fans, then created a new report. The report itself is not based on any data, so its Data Source was left empty. An empty data source will produce a report with one detail section, providing an area to add a minimal set of items to a report.
In my detail section, I added a chart object from the report designer toolbar and set its data source to the query I had just produced (Figure 11).
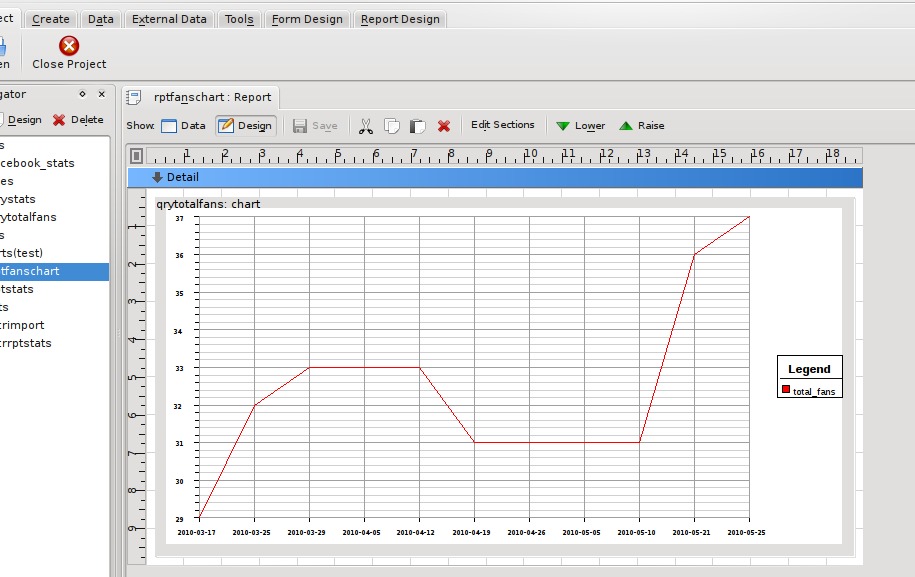
Figure 11. Chart Design
As you can see, even at design time, the chart object is able to gather data and draw a preview of the chart. Switching to the data view shows the chart without any of the extra lines and text from the designer (Figure 12).

Figure 12. Chart Report
When printed, both the tabular report and chart report look as they do in the Data view. When printed using the PDF printer option in KDE, the chart even retains all its detail, as it is not converted to a bitmap, but saved as lines, which makes it completely zoomable!
Saving the tabular report as an HTML document produces two options: saving as a table or using CSS. The table option produces an HTML file where the text from each field in a report is saved as a table cell, and each section is a row. The CSS option uses the <div> tag and tries to create an HTML file that closely resembles the original, allowing text and images to be rendered at arbitrary positions.
The tabular report also exports nicely into an OpenDocument Spreadsheet file for use in either KSpread or OpenOffice.org (Figure 13).
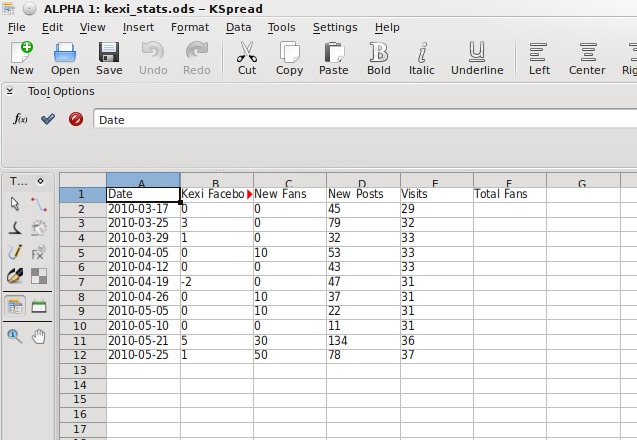
Figure 13. KSpread Data
As you can see from the image, one problem is that the report's title has taken a cell with the other field headings. This is because it is in the same section, but it easily can be fixed by putting the title into a separate section, such as a Page Header.
Kexi 2 is a powerful tool for developing database applications. Find out what else is possible by giving it a try, and if you can, please contribute more documentation at userbase.kde.org/Kexi, or join the team by dropping into #kexi or #koffice on Freenode IRC.
Resources
Kexi Project Facebook Page: www.facebook.com/kexi.project
Building KOffice: wiki.koffice.org/index.php?title=Building/Building_KOffice
Getting Started/Build/KDE4: techbase.kde.org/Getting_Started/Build/KDE4
Adam Pigg is a software engineer who, in his free time, contributes to the Kexi and KOffice projects. He's been contributing to KDE in general for around eight years. His remaining time is occupied by his wife, his four great kids and mountain biking. He usually can be found in #kexi on Freenode, where he will do his best to answer any queries.

