
Server Monitoring with Zabbix
Zabbix (www.zabbix.com) is an open-source, commercially backed monitoring solution that supports UNIX, Linux, BSD, Mac OS X and Windows platforms and is built to support large installations. Zabbix is the creation of Alexei Vladishev and his company Zabbix SIA. This article is based on the latest version of Zabbix, version 1.8.1, which was released in January 2010. At the time of this writing, most Linux distributions include the previous version (1.6) in their repositories. There are significant changes when compared to 1.8, but most of this article still applies. A partial feature list includes:
Distributed monitoring.
Clients for Linux, BSD, Windows, Mac OS X and commercial UNIXes.
Database back end (MySQL, Oracle, PostgreSQL or SQLite).
Auto-discovery mode.
Web-based interface.
Notifications via e-mail, SMS or Jabber.
Support for polling or trapping Zabbix client messages.
SNMP.
Agent-less monitoring (ping, port checks and so on).
Graphs.
Although you can install Zabbix from your Linux distribution's repositories, I'm going to install version 1.8.1 from source using Ubuntu 9.10 for the server platform with a MySQL database back end. I also show how to configure a Linux client with the basic monitoring that comes with a default Zabbix installation.
Before compiling the Zabbix sources, I need to install prerequisite packages:
shell> sudo apt-get install mysql-server apache2
 ↪libapache2-mod-php5 php5-mysql php5-gd
 ↪libmysqlclient15-dev libsnmp-dev libiksemel-dev
 ↪libcurl4-gnutls-dev
(In Ubuntu, the package names are mysql-server, apache2, libapache2-mod-php5, php5-mysql, php5-gd, libmysqlclient15-dev, libsnmp-dev, libiksemel-dev and libcurl4-gnutls-dev.)
The Zabbix sever and client will run as the user zabbix, so you need to create an account:
shell> sudo useradd -s /bin/true zabbix
Next, create the zabbix database:
shell> mysql -u<username> -p<password>
mysql> create database zabbix;
mysql> quit;
Download the source code from www.zabbix.com/download.php, uncompress the archive and then follow the steps below to set up the database schema and default configuration. Note that I am using the MySQL schema files to set up my database; there are different schema files for the other supported databases:
shell> sudo tar zxvf zabbix-1.8.1.tar.gz
shell> cd zabbix-1.8.1/create/schema
shell> cat mysql.sql | mysql -u<username> -p<password> zabbix
shell> cd ../data
shell> cat data.sql | mysql -u<username> -p<password> zabbix
shell> cat images_mysql.sql | mysql -u<username> -p<password> zabbix
To compile the server code, cd back to the root of the extracted zabbix-1.8 source directory, and run the following command to compile the server binaries to have support for MySQL, SNMP and Jabber:
shell> ./configure --enable-server --with-mysql --with-net-snmp
 ↪--with-jabber --with-lib-curl
shell> sudo make install

shell> ./configure --enable-agent --enable-static
shell> sudo make install
I recommend building static binaries for the clients. This helps when deploying the client across different (Linux) versions. Although the make install command builds and installs the server binary zabbix_server, it does not build the client agent binary. To compile the client binaries, cd into zabbix-1.8.1/src/zabbix_agent, and run another make install. The binaries then are installed into /usr/local/sbin—the same location for the server binary:
shell> ./configure --enable-agent --enable-static
shell> cd src/zabbix_agent
shell> sudo make install
Two zabbix binaries are compiled: zabbix_agentd and zabbix_agent. The latter is used to run the client from a superserver, such as inetd, and the former runs as a dæmon. It's recommended to run the zabbix_agentd.
Zabbix uses one configuration file for the server and another for the client. Sample configuration files are available in the zabbix-1.8.1/misc/conf directory. Make a directory called /etc/zabbix, change the ownership of the directory to the user zabbix, and copy the zabbix_server.conf and zabbix_agentd.conf files to this directory.
There isn't much to change in either of the configuration files, but they are well documented within the files themselves. Two configuration parameters in the client zabbix_agentd.conf file that should be changed are the lines Server= and Hostname=. The first should point to your Zabbix server and the second should be the hostname of the client.
With the exception of maybe the DBUser and DBPassword parameters in the zabbix_server.conf file, nothing else needs to be changed if you're running a site with less than a few hosts. Look through both configuration files and refer to the Zabbix documentation for any variables that could be helpful to your site.
You can find several startup script examples within the zabbix-1.8.1/misc/init.d directory. Copy the one for your installation to /etc/init.d, and make any necessary changes. For Ubuntu, I used the scripts located in the debian directory. In both the server and agent configuration files, I needed to change the location of the binary from /home/zabbix/bin to /usr/local/sbin.
The zabbix-1.8.1/frontends/php directory contains the Web-based front end to Zabbix. Copy this directory structure somewhere below Apache's DocumentRoot, and load that URL in your Web browser. You will be greeted with the Zabbix Introduction screen (Figure 1). This wizard-like page steps through your configuration and presents you with a License Agreement. The next screen details any configuration changes that need to be made before continuing, such as PHP memory and execution time settings.
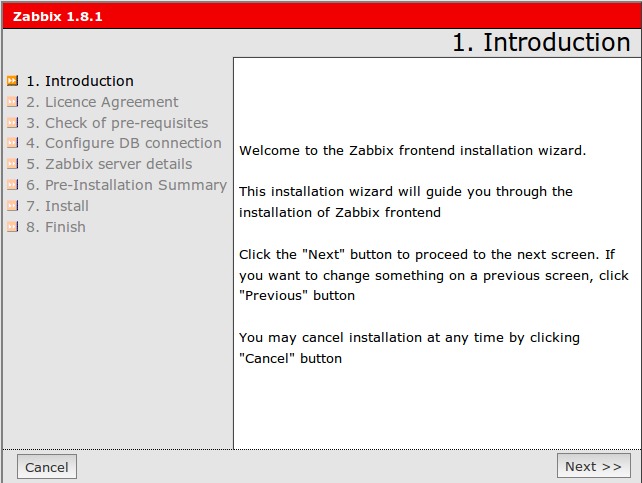
Figure 1. Zabbix Introduction Screen
Once past the configuration screen, the main login screen loads. The default account is Admin with the password zabbix. Of course, once you're logged in, change the default password. The front-end layout consists of two rows of options (Figure 2). Click Administration, then Users. Make sure the pull-down menu located on the right side of the screen has Users selected instead of User Groups. Next, click on the admin user. A configuration page for the Admin user is shown (Figure 3). First, change the password. Also, add an e-mail address (click Add next to the Media line), as we're going to configure alerts to be sent via e-mail later in this article.
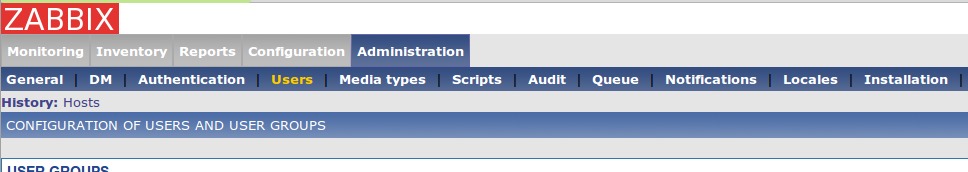
Figure 2. Front-End Options
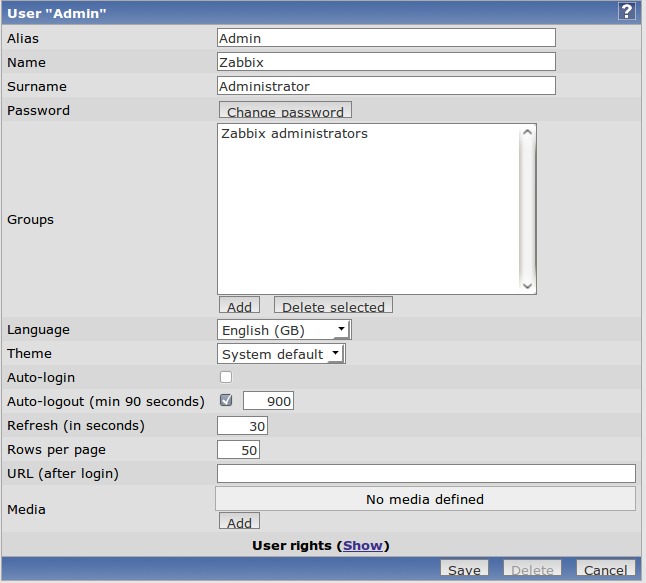
Figure 3. Admin User Configuration Page
Three files need to be copied to a new client: the zabbix_agentd client binary to /usr/sbin, the zabbix_agentd.conf configuration file to /etc/zabbix and an init script. Edit the zabbix_agentd.conf configuration file, and change the line that reads Server= to equal the Zabbix server name, and change the Hostname= line to equal the client hostname. Once completed, start up the zabbix agent with the init script.
Back on the Zabbix server Web page, click Configuration→Hosts within the Web front end. Make sure Hosts is selected in the pull-down menu on the right-hand side of your screen, and then click the Create Host button. The Hosts configuration screen appears (Figure 4). You can give your host any name you choose, but I recommend staying with the short hostname (hostname -s) instead of a fully qualified domain if you can. Add it into the Linux servers group, and populate the DNS name with the fully qualified DNS name. I could choose to monitor this host with its IP address, but I'll trust that DNS always will be up to date. The only other change to this page is to click Add under the Linked templates area. Click the radio button next to Template_Linux and choose Select at the bottom of this pop-up window. Back at the Host screen, click Save. All the monitoring Items and Triggers included in the Template_Linux will be added to the client.
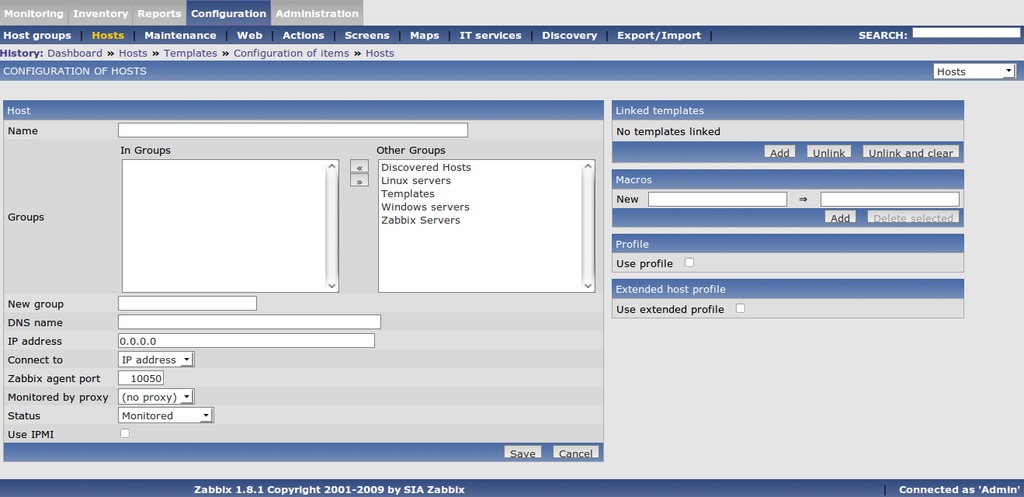
Figure 4. Host Configuration Screen
The Zabbix monitoring structure starts with Items (checks or collects data), then Triggers (monitors data in Items) and finally, Actions (e-mail, SMS or run scripts).
Items can be considered the “data collectors”. Some items are built in to the agent binary, and others will be custom scripts. After installing Zabbix, you will have a range of templates that contain these Items for common operating systems checks, such as Linux, Solaris, MAC OS X and Windows systems.
Let's look at the template we used with our first client. Using the Global search box at the upper right-hand side, search for “Template_Linux”. The search results should return a page that has links to the Items, Triggers or Graphs for this template (Figure 5). Select the Items link. All these Items will be monitored on any host that has the Template_Linux template applied to it, such as the first host configured above.
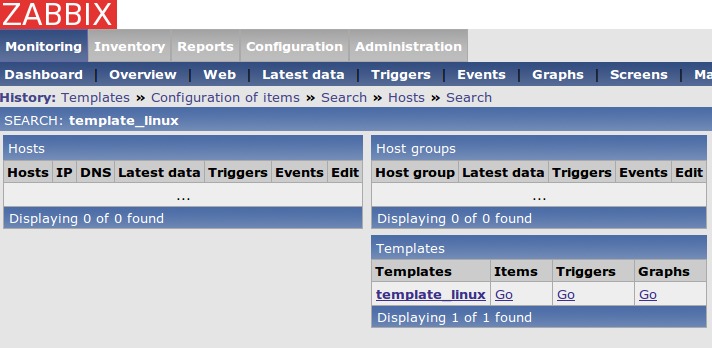
Figure 5. Template_Linux
Click the Item called Free disk space on /. Here are all the details for this Item (Figure 6). Most fields are self-explanatory, but here are few important ones:
Description: a free form field that describes the check. Note that in the free disk space check there is a $1. Zabbix replaces this with the first field in the key (explained later).
Type: a Zabbix agent type is a check preformed by the agent running on the client at defined intervals. A Zabbix agent check is compiled in the binary, such as checking free disk space, number of free/used inodes or a custom written script. Another type is a Zabbix Trapper. A Zabbix Trapper acts like an SNMP trap. Its value is updated only when the client sends the update by running the binary zabbix_sender. For example, say you have a cron job that takes 30 minutes to finish. Normally, the Zabbix server will timeout waiting for a response from the client running this script. A better way would be to add a line in the cron job script to update the Zabbix server when it's finished using the zabbix_sender program. Another type of check is called Simple checks. This is used for agent-less clients—for example, pinging a host or checking a specific port (e-mail, SSH and so on) with an external host.
Key: this field is the “expression” that Zabbix will check. It can be a built-in key, such as the free disk space item (vfs.fs.size[/,free]) or a custom script that you wrote. The documentation details all the built-in keys and expressions that can be used.
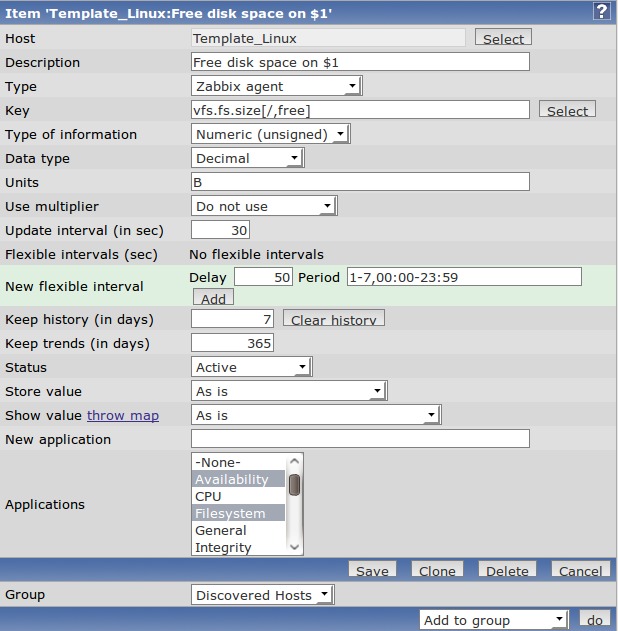
Figure 6. Free disk space on / Item
You also can tell Zabbix what type of data is going to be returned: text, characters or numbers and a multiplier for that value. Also, you can specify for how long you want fine-grained graphs (history) and trends. The Applications section is where you can group similar checks. For example, if you were adding another filesystem item, you would add it to the Filesystem application.
Select the Triggers link from your Global search results (Figure 5). A trigger in Zabbix monitors the data that the Items collect. If the data exceeds a configured threshold, it's assigned to one of six severity levels. Figure 7 shows the triggers that come with Template_Linux. Displayed are the severity level, status, description and an expression that makes up the trigger. Click on the trigger named Low free disk space on Template_Linux volume /, and the trigger configuration screen should come up (Figure 8).
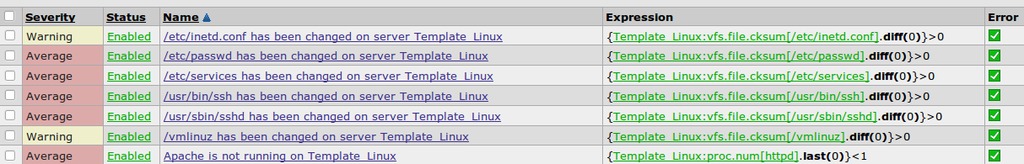
Figure 7. Template_Linux Triggers
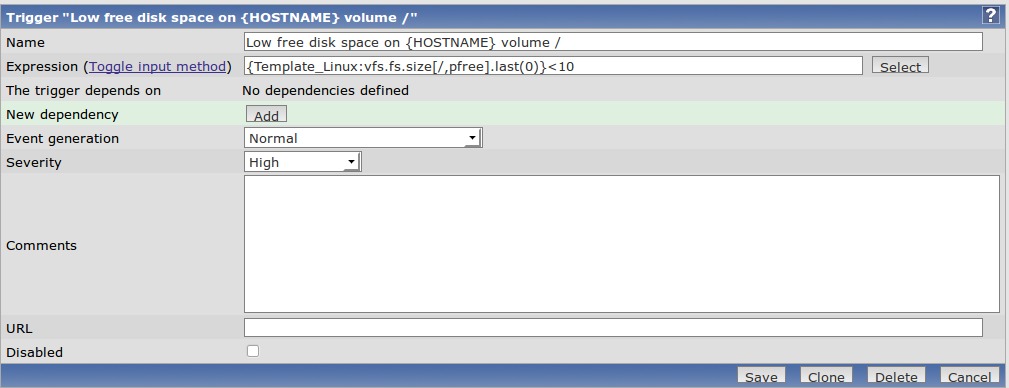
Figure 8. Trigger Configuration Screen
The first field, the Name field, should describe the problem. For instance, “IMAP port not responding on server123” is better than “E-mail down”. This most likely will be the text that you're going to receive in an e-mail, page or SMS message, so a clear, descriptive name will be very helpful at 2am should that call occur.
The Expression field is what Item this Trigger is going to monitor and what its thresholds are. Our expression for this trigger is configured with {Template_Linux:vfs.fs.size[/,pfree].last(0)}<10", which loosely reads, “Monitor the host called Template_Linux and its key vfs.fs.size[/,pfree]. If the last value it returned is less than 10, assign it a severity level of High.” Click Select. From here, you can change the expression to trigger on averages, absolute values or maximum values for a period of time. For now, I'll leave the trigger function as is, except I want to change at what value it triggers. So close the Condition pop-up window and change the expression to 5% by changing the value from 10 to 5 at the end of the line. Click Save to make the changes.
Actions occur when a trigger is activated. They can be via e-mail, Jabber, SMS message or running a remote script. Let's configure an action to e-mail the admin if any trigger with level Disaster has been activated. Select Configuration→Actions, and then the Create Action button on the right-hand side of the screen. The Configuration of Actions screen should be visible (Figure 9). Name it something helpful, then click the New button under Action conditions. Choose Trigger severity from the New Condition area, and change the severity level from Information to Disaster. Click Add when finished. Next, select the New button in the Action operations area. Configure the operation to send a message to a single user named admin (Figure 10). Click Add when done. Finally, click the Save button. Now, any trigger that you assign the severity level of Disaster will result in an e-mail being sent to the Admin user. You can create Actions for a single trigger from a specific host if needed, but the action above can be treated like a “site-wide” action.
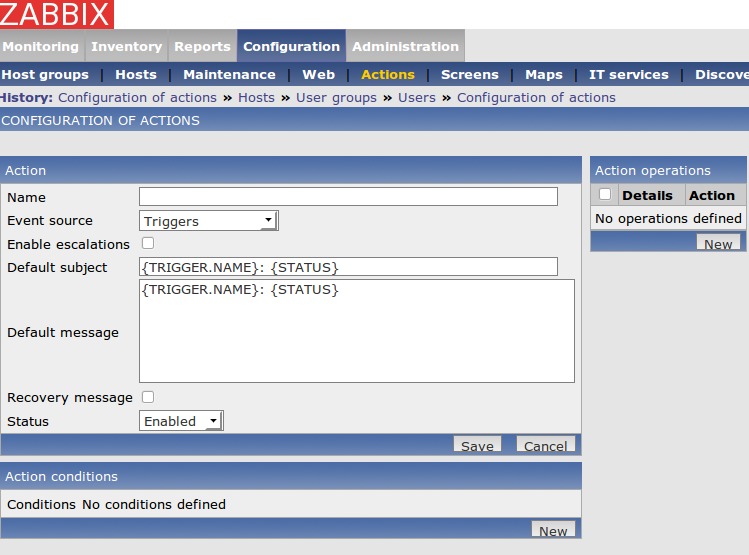
Figure 9. Configuration of Actions Screen
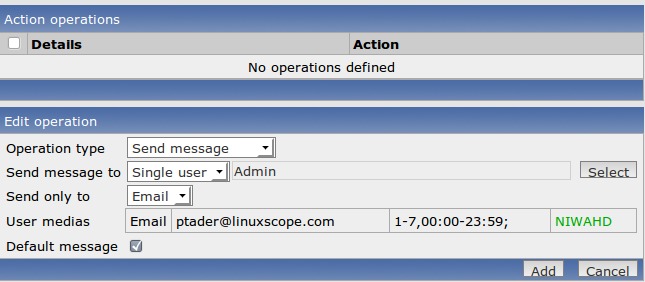
Figure 10. Configuring the Operation
There are several ways to monitor the clients you have configured. One of the screens I find most informative is the Status of Triggers Web page. Click Monitoring→Triggers (make sure Group and Host have “all” listed from the pull-down on the right-hand side of the screen). On this screen, Zabbix lists all the triggers that have been activated, their assigned severity level, the date of last change and short description as well as an Acknowledged and Comments column. This could be considered a sysadmin's to-do list.
Paul Tader is an independent consultant implementing open-source solutions in the Chicago area, where he has run every Linux and BSD flavor since the mid-1990s as well as instructing Linux certification courses at a local college. Feel free to contact Paul at ptader@linuxscope.com.

