
New Projects - Fresh from the Labs
If you've got a stack of MiniDiscs lying around rotting, because you hate rebooting into Windows just to have basic access to your hardware, others exist who share your pain. One of these people is Adrian Glaubitz. Adrian sent me an e-mail, saying the following:
Almost all newer MiniDisc-Walkmans made by Sony and other manufacturers have a USB-connector that allows download and upload of audio tracks and data to the MD-Walkman from a PC. However, since Sony is also a major record label, it has adopted a sophisticated system of DRM protection that requires a proprietary software from Sony called SonicStage, which runs on Windows only; even the latest Wine version is not able to run it smoothly enough to allow transfer from/to an MD-Walkman.
Being a passionate Linux user since 1998, Adrian was annoyed by always having to reboot into Windows to do anything with his player. There were Linux projects around, but they never allowed him to do much more than control his player—audio transfers were impossible. Adrian then decided to start this project, together with a friend who'd been working on parts of Wine for years (a great exercise in reverse engineering), and now the project has almost 20 people (some from older/defunct MiniDisc projects) contributing to the program in some form or another.
The Linux MiniDisc Project now is at the point of basic GUI interaction and functionality with your player—a major milestone for previously neglected MiniDisc users.
Tech heads should have a look at some of the additional console tools available for further device wrangling.
Installation
First, there are many strange library requirements to take care of, so jump into your package manager to grab these elusive creatures (they might have different names in your distro, but the following at least should give you a clue):
libqt4-dev build-essential libglib2.0-dev
 ↪libmad0-dev libmcrypt-dev cmake libsox-dev
 ↪libmcrypt4 libmcrypt-dev cmake
To download the source, grab the repository using git. Open a terminal, and enter a directory where you won't mind the source being saved. Now, enter the following command:
$ git clone git://z6.physik.fu-berlin.de/linux-minidisc
This project is broken down into two major parts: libhimd (the library) and QHiMDTransfer (the GUI application). Let's compile both of them at once. Change into the linux-minidisc directory, and compile the program with the following commands:
$ cd linux-minidisc
$ cmake .
$ make
Take note of the . character after cmake; it's not a misprint, and you'll need it! Once compilation has finished, change into the QHiMDTransfer directory and run the program, like so:
$ cd QHiMDTransfer
$ ./QHiMDTransfer
Usage
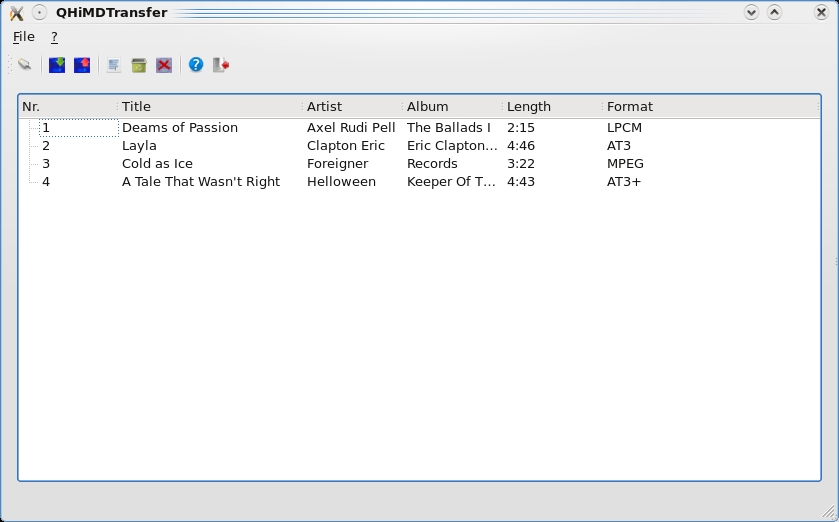
Once you're inside the application, you need to mount your MiniDisc device before you can browse it, upload to it or download from it. If you don't have a MiniDisc device, but you're still interested in exploring this program's features, there's an image you can use to simulate the device available on the given wiki page, along with instructions. When you have your device mounted, click File→Connect, and choose the folder under which your MiniDisc player is mounted.
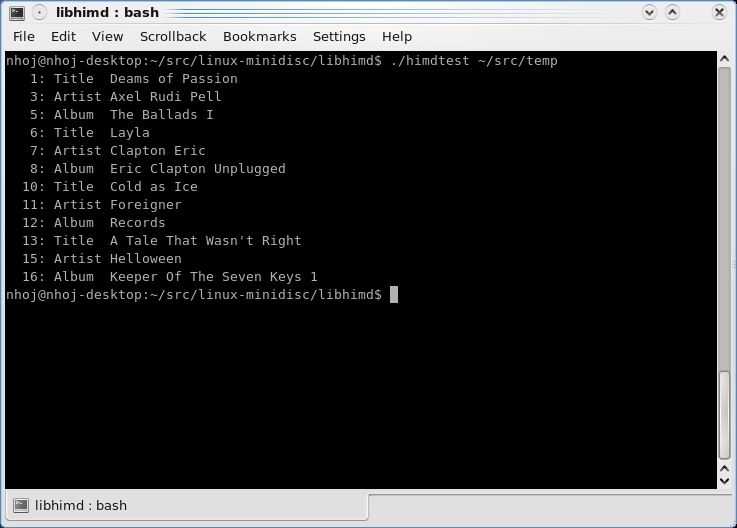
If all goes well, your player's contents will come up in the main window. From here, you can choose to copy to or from the player with some fairly obvious cues from the GUI (it's a pretty basic interface). For those interested in doing more with their MiniDisc players, there are also tools like himdtest in the libhimd directory for things like track uploading, encryption info and so on.
For the moment, you can upload only MP3s and unencrypted PCM files as WAVs, but the team is working on total functionality. As Adrian told me:
We are now very confident that soon we will have finished completely reverse-engineering the necessary protocols and file formats, so that there will be complete support for MiniDisc on Linux without any limitations by DRM, which are imposed by the original bloated Windows software. Once we have a first stable version, a friend of mine who is a Debian developer will help get the software into Debian and make it available to all Debian/Ubuntu-users.
I hope they do. The more niche hardware that's supported by Linux, the more our OS will be known for hardware-friendliness. Adrian tells me that he's also chasing some Qt programmers who can spruce up the GUI a little, so if you're a programmer on the lookout for a project to contribute to, give him a shout.
According to SocNetV's Web site:
Social Networks Visualizer (SocNetV) is a flexible and user-friendly tool for the analysis and visualization of Social Networks. It lets you construct networks (mathematical graphs) with a few clicks on a virtual canvas or load networks of various formats (GraphViz, GraphML, Adjacency, Pajek, UCINET, etc.) and modify them to suit your needs.
The application can compute basic network properties, such as density, diameter and distances (shortest path lengths), as well as more advanced structural statistics, such as node and network centralities (i.e., closeness, betweenness, graph), clustering coefficient, etc.
I tried reading that a few times and my brain exploded, so I thought I'd give it a look and find out just what it was all about and explain it in human language. What I discovered was a deceptively simple yet sophisticated program that organizes collected data in very cool ways. Now, I must state from the outset that it has nothing to do with social networking in the guise of MySpace, Facebook and so on (although you could use it for plotting those things out if you really wanted to). SocNetV is a means of plotting data in new and original ways.
SocNetV lets you plot data and shift it around, link sections and find constellations in the sea of information.
When you make your first few clicks, it appears to be just another basic plotting program, where you can make a flowchart or some other kind of information “tree”. Not so. The advanced mathematical features turn grid points into a fluid, almost organic organism that can change and adapt in real time and reveal all sorts of patterns and flow in what appears at first to be stagnant information.
Installation
If you head to the Web site's download section, SocNetV is available in packages for just about any distro you can shake a stick at, as well as a Windows binary, the usual source and even a Klik package (I haven't seen one of those for a while). I went with the Ubuntu package, but if your distro isn't on the list, or if you would prefer the source for whatever reason, you can do that too. If you are compiling from source, you need to grab the Qt4 development files, along with the QtWebKit development files. When you're ready, grab the source, extract it and open a terminal in the folder. From here, it's a case of doing the usual:
$ ./configure
$ make
$ sudo make install
Once the installation has finished, you can run the program by entering:
$ socnetv
If you're lucky, it'll also be in your system's menu; mine was under Education→Mathematics→Social Networks Analysis and Visualisation.
Usage
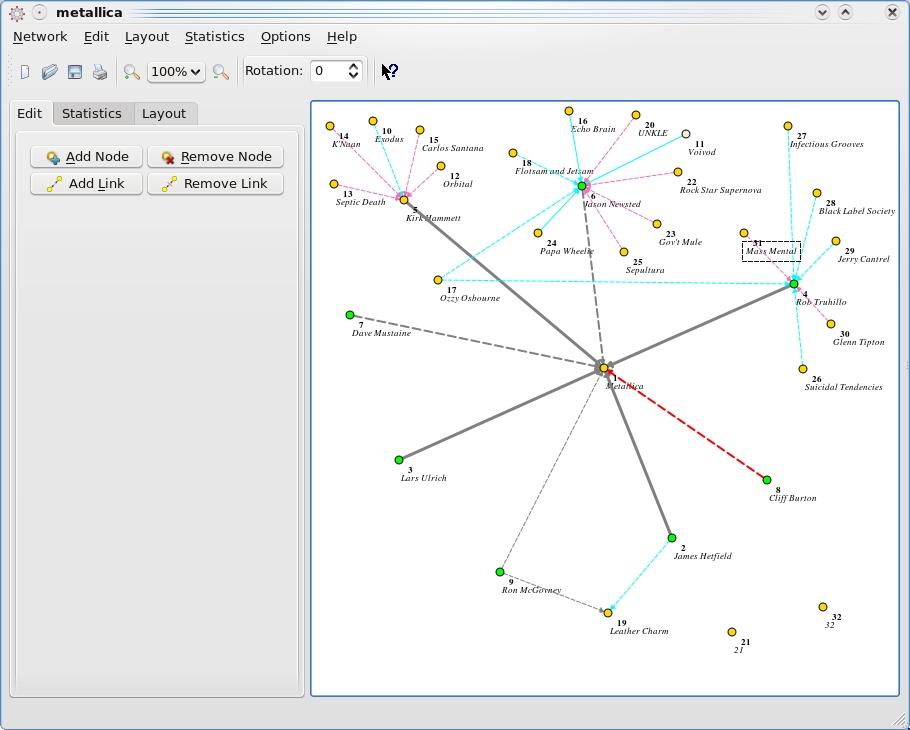
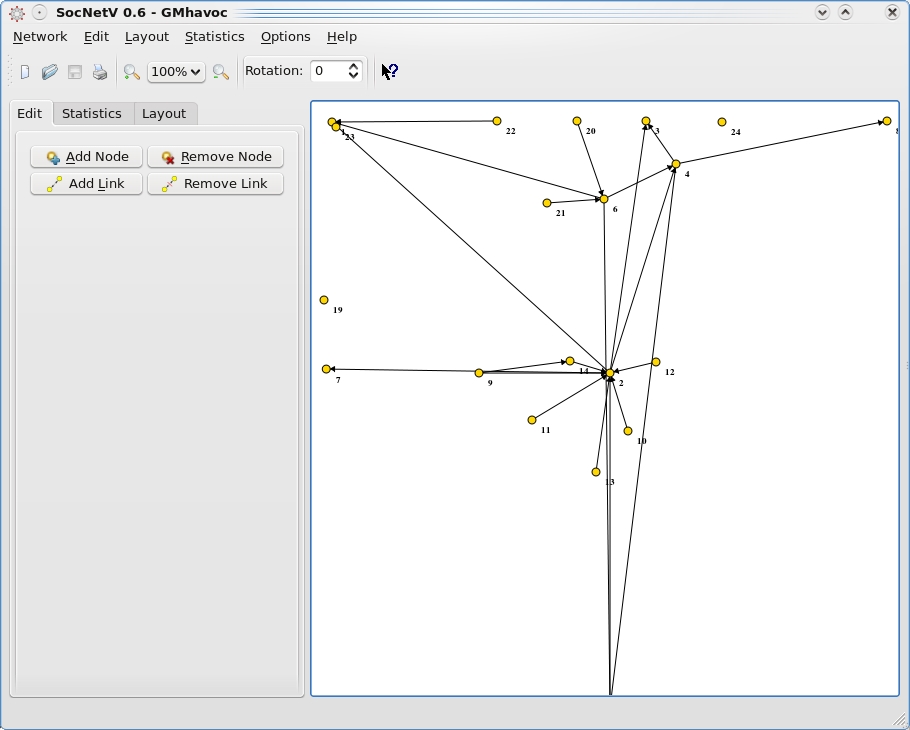
Once inside, the first thing you'll see is a large blank white space, which is where your networks will be drawn. On the left are controls to Add or Remove a Node and to Add or Remove a Link. These are the most important controls, and you'll use them a lot. Now, let's create our first node.
Click Add Node, and a small yellow circle appears in the blank space on the right. This first node automatically becomes the first point of reference for all the other nodes, so it's best to make this node the most important—the nucleus, the genesis from which all the other nodes spring. With the node made, it's best to give this first node a label that sticks with the idea of it being a reference point.
Say you were mapping out your MySpace friends (goodness knows why, but let's run with it). You might want to name the first node something like “My Home Page”. Or, let's say you were a Dr Who fan mapping out the Dr Who universe; you might want to call the first node “The Doctor”, and so on. You can do this by right-clicking on the node, and choosing Options→Change Label.
Now, to add your surrounding nodes, click Add Node again, and a new node with the number 2 appears on the screen. To link this to node number 1, click Add Link. A series of prompts now appears in regard to the rest of the field of nodes, which is just the two for now. First up is the target node—1, by default. Next is the strength of the link, which, by default, will be 1.0. This value is very important, as it defines how valuable/important/relevant the link is to another node. You can use any number between –20 to 20, with positive numbers drawing a solid line between nodes and negative numbers drawing dotted lines. The higher the number, the thicker the line.
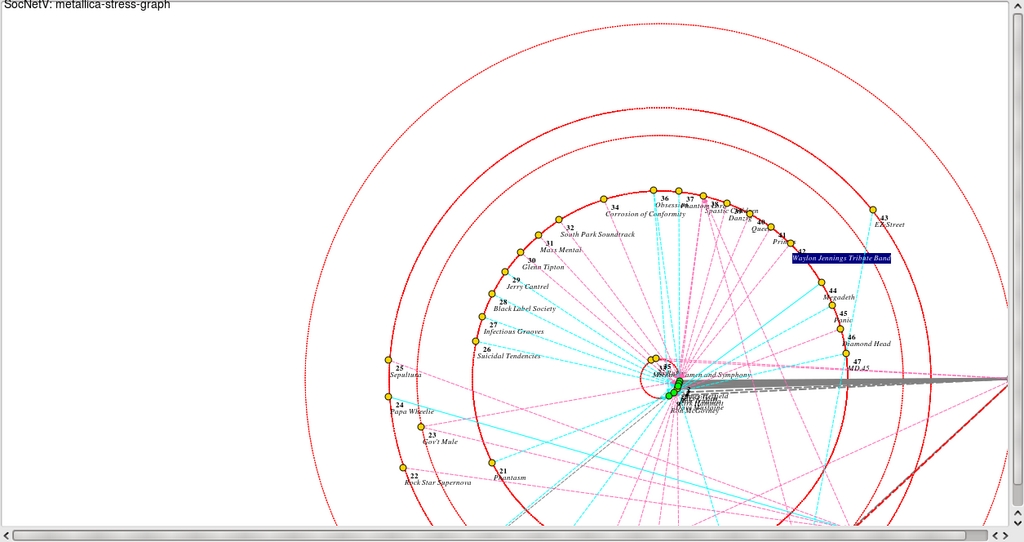
You've now connected your first two nodes, and from here I suggest adding some more to get the idea. If you right-click on a node, you'll notice the Options menu has a number of things to play with in terms of customizing each node, such as turning it into a square, changing the color and so on. Doing so helps differentiate one kind of node from another, helping to define what information it is representing visually. For instance, in my diagram of Metallica's history and affiliations (a band with a loaded history and a great deal of influence—a perfect testing ground for this kind of thing), band members are represented by a green circle, and bands/collaborators are represented by yellow circles.
My Metallica chart in all its glory! Well, there's a few mistakes, but I'm sure you won't mind.
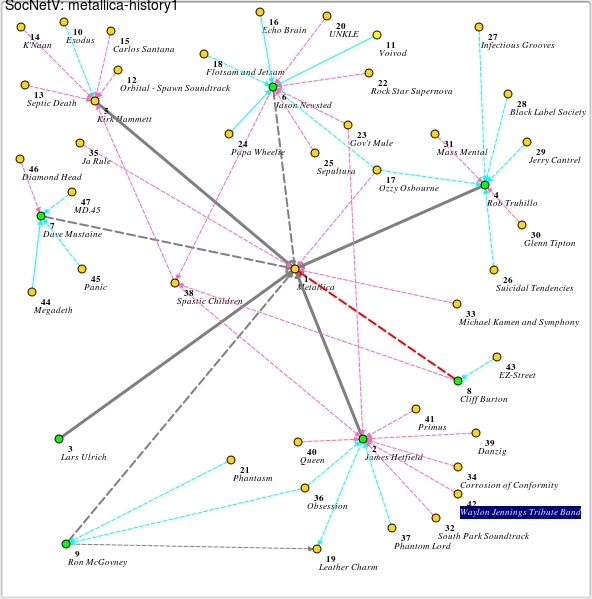
You also can change the color of each line linking a node, adding more differentiation to a sea of probably messy information. For actual band members, I've gone with a strong gray line, with a dotted line for ex-members, and red line for the late Cliff Burton (RIP). Actual bands and important projects are signified by blue lines, and casual projects and one-offs are represented by pink lines. Don't forget that you also can move around nodes by left-clicking and dragging if things get messy and you need to do some rearranging.
Once you've made yourself a full grid of information, you can apply a bunch of crazy mathematics that can morph your information in real time, showing you new patterns in the information that you probably never thought of before. Check out the Layout menu and experiment with all the options for a real demo, which showcases what this program is really all about.
Advanced mathematics can morph your networks around in real time (as this screenshot is in the middle of doing), as your structure begins to resemble a moving, almost breathing organism.
Certain preset formulas can constellate your information, showing you new information in otherwise banal data.
Although this project still has a few kinks and interface problems, anyone interested in the flow of information and discovering patterns in any area of life definitely should check out this project. In terms of industry, social analysts looking for new patterns in society, wealth and so on would find this of particular use. I'd also like to try using it in Analytical Psychology, mapping out various constellations of ideas in someone's psyche. There are endless uses for a tool like this that are limited only by your imagination—fascinating stuff.
Brewing something fresh, innovative or mind-bending? Send e-mail to newprojects@linuxjournal.com.
John Knight is a 25-year-old, drumming- and climbing-obsessed maniac from the world's most isolated city—Perth, Western Australia. He can usually be found either buried in an Audacity screen or thrashing a kick-drum beyond recognition.

