
Ajax Timelines and the Semantic Web
Timeline uses Asynchronous JavaScript and XML (Ajax) to provide a nice interface for browsing information that has a time component. The Timeline Web site describes Timeline as “...Google Maps for time-based information”.
Timeline lets you view points and durations of time in an intuitive manner. I refer to these as time events or just events when the context is clear. Many bands at different granularities—hour, day, month, year and so on—can show you how events relate to each other. You can use the mouse to drag around the display, or double-click on the Timeline to center at that time. All events can have click bubbles showing a little HTML with links and images.
Using Timeline itself requires no software installation on the client or Web server. Although there are no requirements for installing Timeline, while developing Timeline Web sites, you can improve reload speed by installing Timeline on the local machine. To do this, check out a copy of Timeline from Subversion, and change the script path in your Timeline HTML files to point to your local copy.
Listing 1. Get Timeline from Subversion for quicker reloads.
$ svn checkout \
http://simile.mit.edu/repository/timeline/
Timelines are normally generated in the onLoad() JavaScript function of the HTML page body. An HTML div element is defined where the Timeline itself is to be generated. Call Timeline.create() in the onLoad() JavaScript function, passing the ID of this div element and the information to use for the Timeline.
Many day, week, month and year sliders can be created using the Timeline.createBandInfo(), which selects the time unit and screen size relative to the entire Timeline that each band will consume. The Timeline is populated with time event data from an XML file using Timeline.loadXML(). An update function also should be called in onResize() to allow the Timeline to redraw itself.
An HTML file showing a Timeline is provided in Listing 2. First, we include the timeline-api JavaScript file directly from mit.edu. The bulk of the work is done in the onLoad() function that generates two bands: one showing days and the other months. The two bands are passed as an array into Timeline.create(), along with the HTML ID of the div tag where we want this Timeline to be. The bands are connected to an event source object, through which we then load our Timeline XML file. The syncWith setting makes sure that when you drag one time band the other will follow. Our OnResize() function makes sure that Timelime.layout() is called to update our Timeline. The rest of the HTML file simply defines a few other elements and a div tag where we want our Timeline to be created.
The XML file containing the dates is shown in Listing 3. This contains two types of durations: one we are sure of and one that is just a rough window of time. Because the XML file does not contain isDuration=“true” for the Versailles event, it will be shown differently on the Timeline. The final event is a fixed single point in time when our flight leaves.
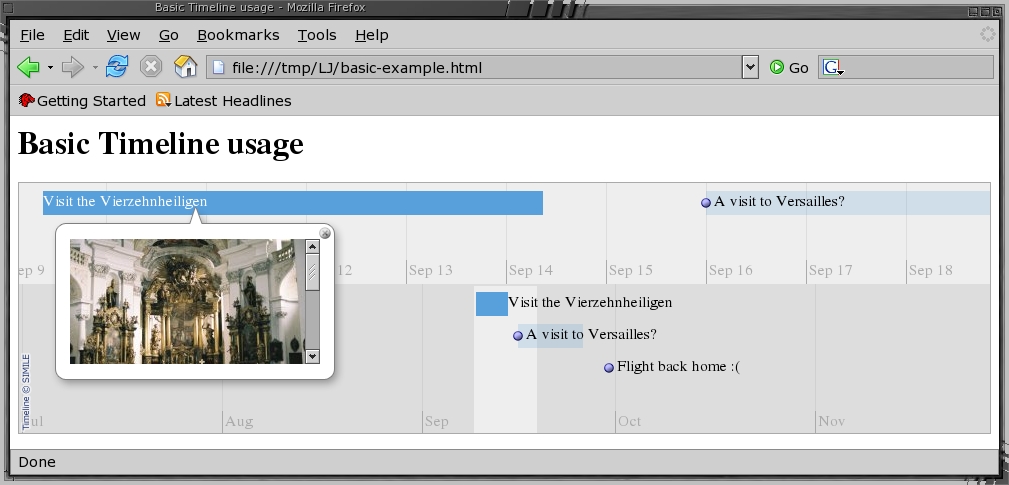
Figure 1. A Basic Timeline in Firefox
Events can have links, images and an HTML content associated with them. The screenshot in Figure 1 shows how this example is rendered by Firefox. Here, I have clicked on the Vierzehnheiligen event to show its image, and below that will be the HTML associated with this event.
A band on the Timeline can be nonlinear. For example, this band could display days as its default unit until it hits a hectic period, at which point it shows hour units for a three-day period before reverting to days as its default unit. This is done using Hot Zones, which are created by calling Timeline.createHotZoneBandInfo() instead of Timeline.createBandInfo() and passing an array of band information.
Listing 2. HTML Showing a Basic Timeline
<html>
  <head>
    <title>Basic Timeline usage</title>
    <script src=
"http://simile.mit.edu/timeline/api/timeline-api.js"
      type="text/javascript">
    </script>

    <script>
function onLoad() {
  var eventSource =
    new Timeline.DefaultEventSource();

  var bandInfos = [
    Timeline.createBandInfo({
        eventSource:    eventSource,
        date:           "Sep 14 2006 00:00:00 GMT",
        width:          "40%",
        intervalUnit:   Timeline.DateTime.DAY,
        intervalPixels: 100
    }),
    Timeline.createBandInfo({
        eventSource:    eventSource,
        date:           "Sep 14 2006 00:00:00 GMT",
        width:          "60%",
        intervalUnit:   Timeline.DateTime.MONTH,
        intervalPixels: 200
    })
  ];
  bandInfos[1].syncWith = 0;
  bandInfos[1].highlight = true;
  tl = Timeline.create(
    document.getElementById("my-timeline"),
    bandInfos);
  Timeline.loadXML("basic-example.xml",
    function(xml, url) {
      eventSource.loadXML(xml, url); });
}

var resizeTimerID = null;
function onResize() {
  if (resizeTimerID == null) {
    resizeTimerID = window.setTimeout(function() {
      resizeTimerID = null;
      tl.layout();
    }, 500);
  }
}
    </script>
  </head>

  <body onload="onLoad();" onresize="onResize();">
    <h1>Basic Timeline usage</h1>

    <div id="my-timeline"
      style="height: 250px; border: 1px solid #aaa">
    </div>

  </body>
</html>
Listing 3. Dates and durations are defined in an XML file.
<data>
<event
start="Sep 9 2006 09:00:00 GMT"
end="Sep 14 2006 09:00:00 GMT"
isDuration="true"
title="Visit the Vierzehnheiligen"
image="vierzehnheiligen-thumb.jpg"
>
Visit this impressive church in Germany. More
information can be found at its
<a href=
"http://en.wikipedia.org/wiki/Vierzehnheiligen"
>Wikipedia page</a>.
</event>
<event
start="Sep 16 2006 00:00:00 GMT"
end="Sep 26 2006 00:00:00 GMT"
title="A visit to Versailles?"
image="versailles-thumb.jpg"
link="http://www.chateauversailles.fr/en/"
>
Sometime in this window I should
get out to Versailles.
</event>
<event
start="Sep 30 2006 00:00:00 GMT"
title="Flight back home :("
>
The joy has to end sometime :(
</event>
</data>The default timeline theme is low contrast grey on grey for the font and background with blue highlights for events. This can be customized using a combination of JavaScript and Cascading Style Sheets (CSS), depending on what you want to change. To change the background colors and some of the time bands, you can create an instance of the default theme JavaScript object, make modifications to that object and then pass it to Timeline.createBandInfo(). The font colors are set using CSS.
Listing 4 shows the changes needed for the previous HTML file to modify the band colors and font information. After including the timeline-api, we override two of the CSS classes to change the font color and enlarge the major date markers. The band colors and click bubble size are properties of the theme object. This modified theme object is then passed as a parameter to the Timeline.createBandInfo() function when creating the bands. The result is shown in Figure 2.

Figure 2. A Themed Timeline with Bands Changed to Months and Years
Listing 4. A More Lively Theme
<script src=
"http://simile.mit.edu/timeline/api/timeline-api.js"
type="text/javascript"></script>

<style type="text/css">
.timeline-ether-marker-bottom {
 width:        5em;
 height:       1.5em;
 border-left:  1px solid #aaa;
 padding-left: 2px;
 color:        black;
}
.timeline-ether-marker-bottom-emphasized {
 width:        5em;
 height:       2em;
 border-left:  1px solid #aaa;
 padding-left: 2px;
 color:        black;
 font-size:    120%;
 font-weight:  bold;
}
</style>

<script>
function onLoad() {
var eventSource = new Timeline.DefaultEventSource();

 var theme = Timeline.ClassicTheme.create();
 theme.ether.backgroundColors[0] = '#DFD';
 theme.ether.backgroundColors[1] = '#EDD';
 theme.ether.highlightColor = '#E00';
 theme.ether.highlightOpacity = '30';
 theme.event.bubble.width = 520;
 theme.event.bubble.height = 120;

 var bandInfos = [
  Timeline.createBandInfo({
   ...
   intervalPixels: 100,
   theme:          theme
  }),
  Timeline.createBandInfo({
   ...
   intervalPixels: 100,
   theme:          theme
  })
 };
...syslog is a great source of highly time-related information. Perl makes it easy to convert syslog files into the XML format required by Timeline. In this example, I convert from the format used by /var/log/messages in Fedora Core 5 into a Timeline XML file, shown in Listing 5. The main complication is that, by default, the year is not included in the date and time specification in the syslog file. This makes the regular expression to split the input more complicated, as we want to get the date and time separately, so we can insert the year between them in the output.
Listing 5. Converting a syslog File from stdin into a Timeline XML File on stdout
#!/usr/bin/perl
use XML::Writer;
my $writer = XML::Writer->new();
$writer->xmlDecl();
$writer->startTag('data');

$thisyear=((localtime)[5]+1900);

while( <> ) {
  # The if() is all one line.
  if( /([a-zA-Z ]+[0-9]+) ([0-9]+
:[0-9]+:[0-9]+) ([^:]+):(.*)/)
  {
    $date=$1; $time=$2;
    $src=$3;
    $msg=$4;
    $writer->startTag(
      'event',
      'start' => "$date $thisyear $time",
      'title' => $src
    );
    $writer->characters( $msg );
    $writer->endTag('event');
  }
}

$writer->endTag('data');
$writer->end();
Making the Timeline higher and including three bands makes jumping around in the logs easier, as shown in Listing 6.
Listing 6. Three Bands to Best Move around Daily Events
var bandInfos = [
  Timeline.createBandInfo({
      eventSource:    eventSource,
      date:           "Sep  7 2006 00:00:00",
      width:          "40%",
      intervalUnit:   Timeline.DateTime.MINUTE,
      intervalPixels: 100
  }),
  Timeline.createBandInfo({
      eventSource:    eventSource,
      date:           "Sep  7 2006 00:00:00",
      width:          "30%",
      intervalUnit:   Timeline.DateTime.HOUR,
      intervalPixels: 200
  }),
  Timeline.createBandInfo({
      eventSource:    eventSource,
      date:           "Sep  7 2006 00:00:00",
      width:          "30%",
      intervalUnit:   Timeline.DateTime.DAY,
      intervalPixels: 200
  })
];
bandInfos[1].syncWith = 0;
bandInfos[1].highlight = true;
bandInfos[2].syncWith = 0;
bandInfos[2].highlight = true;Generating and updating Timelines becomes simpler when combined with some Semantic Web technologies. The two main ones of use here are an RDF store supporting the SPARQL query language and an XSLT engine to generate JavaScript Object Notation (JSON) files.
Using RDF lets you maintain a single store of information and choose whatever data is of interest using queries. Also, with RDF you can merge information from multiple sources easily into a single Timeline. For example, it might be handy to see the modification times of files along with syslog events on a single Timeline.
Using JSON allows the JavaScript for a page to access time events as normal JavaScript objects. So, you can, for example, center the page by default on the oldest, newest or a named event from the JSON data. This is very handy if the time events change, as the JavaScript will still center the page correctly without modifying the HTML file to point to the desired time explicitly.
RDF is the Resource Description Framework that is the lowest layer of the Semantic Web. Everything is described in terms of triples in RDF—for example, Ben, programs, C++.
Unlike the previous example, triples in RDF are constructed using Uniform Resource Identifiers (URIs) and Objects. A URI is very similar to a URL. The main difference is that URIs are not expected to resolve to something that you can browse on the Net but are intended only to identify something uniquely. Many people use http:// URLs as URIs. The previous example would more likely be expressed in RDF as shown in Listing 7. Normally, people would not be identified uniquely by their first name only.
The additional verbosity of URIs is not really a concern, because most things dealing in RDF will let you define namespaces similar to XML. For example, setting kvo to expand to http://www.kvocentral.org/rdf/ would shorten the first part of the example triple to kvo:person/Ben. The three parts of a triple are referred to as the Subject, Predicate and Object. It is convenient to think of the subject as defining the thing you are describing, the predicate as defining what part of the subject you are describing and the object as the description itself.
Listing 7. A Simple RDF Triple
http://www.kvocentral.org/rdf/person/Ben,
http://www.kvocentral.org/rdf/activity/programs,
http://www.kvocentral.org/rdf/programming-language/C++
SPARQL is a query language for RDF data. SPARQL borrows some notation from SQL. Variables in SPARQL are defined using ?varname. When a variable appears more than once in the where clause it must have the same value for each appearance. For example, the SPARQL query in Listing 8 can return multiple ?x, ?name pairs, but each ?x returned will have a location of Sydney. The optional clause means that if ?x happens to have a digital longitude associated with it, that will be returned as well.
Listing 8. A SPARQL-like Query for Blogs
SELECT ?x ?name ?dlat
WHERE {
  ?x has-name ?name .
  ?x has-location "Sydney" .
  OPTIONAL { ?x geospat:longitude ?dlat } .
}
Some of the following code is from or based on the ESW SparqlTimeline page (see the on-line Resources), in particular, the sparql2timeline.xsl file.
I attempted to use the Redland and Rasqal combination for RDF+SPARQL but ran into troubles with SPARQL processing. Redland is still developing its SPARQL query implementation. I then moved to using Jena for RDF processing. The Jena Project is well known for being a feature-rich and robust RDF library. For more information on playing with RSS blog feeds with Jena, see my article “Creating a Planet Me Blog Aggregator”, which appeared in the April 2006 issue of Linux Journal.
Jena is written in Java, and thus, you'll need a JRE. Jena itself is easy to install; simply unzip it somewhere and add its jar files to your CLASSPATH environment variable. For a bash shell, this is shown in Listing 9.
Listing 9. Setting Up Jena 2.4
$ cd ~
$ unzip Jena-2.4.zip
$ edit ~/.bashrc
# append a handy classpath setup
JenaSetup() {
    for if in ~/Jena-2.4/lib/*.jar; do
        export CLASSPATH=$CLASSPATH:$if;
    done
}
$ . ~/.bashrc
$ JenaSetupIndividual Blogs and the Planet Blog aggregator normally offer RSS 1.0 feeds. The shell commands to show a Planet on a Timeline are shown in Listing 10. The planet GNOME RSS feed URL could have been included directly into the Jena SPARQL command. Keeping it separate allows you to archive your blogs or combine many blogs into a single RDF file for querying.
The final command converts the XML file containing the results of the SPARQL query into a JSON file. Because the XSLT outputs plain text, there could be many newlines in places where a browser does not like them. The main offender here is newlines inside of a blog's HTML content. Because the output is JSON, the blog entry's content has to be contained in a JavaScript string declaration. Having a JavaScript string declaration extend over multiple lines by just ending each line with a newline will confuse many browsers. A simple remedy is to use the tr(1) utility to replace newlines with harmless space characters.
Listing 10. Generate a Timeline for Planet GNOME.
wget -O planet-gnome.xml \
  http://planet.gnome.org/rss10.xml
java jena.sparql \
  --data planet-gnome.xml \
  --query rss.rq --results xml \
  >|planet.xml
xsltproc sparql2timeline.xsl planet.xml \
  | tr '\n' ' '  >|planet.json
The SPARQL query itself is shown in Listing 11. Each Blog post is an RSS item. The first line in the WHERE clause restricts results to news items (blog posts). The subsequent lines select the information about each blog post we are interested in for the SELECT clause.
Listing 11. SPARQL Query for Blogs
PREFIX rdf: <http://www.w3.org/1999/02/22-rdf-syntax-ns#>
PREFIX rss:  <http://purl.org/rss/1.0/>
PREFIX rssc: <http://purl.org/rss/1.0/modules/content/>
PREFIX dc: <http://purl.org/dc/elements/1.1/>

SELECT distinct ?title ?link ?date ?description
WHERE {
  ?x rdf:type rss:item .
  ?x rss:link ?link .
  ?x rss:title ?title .
  ?x dc:date ?date .
  ?x rssc:encoded ?description
}
ORDER BY DESC(?date)
There are a few changes that can be made to the driving HTML file to make viewing the results of blog queries simpler. The first option is to set the default target date to be a few hours before the current time. We shift a few hours back from the current time because the finest granularity time band on the Timeline is hours. This places the most recent posting to the right of the Timeline instead of in the center. The fragment that needs to change revolves around the bandInfos declaration, as shown in Listing 12.
Listing 12. Focus the timeline on the current time and date.
var moveRightOffetInHours = 4;
var gmtd = new Date();
var ms = gmtd.getTime()
   + (gmtd.getTimezoneOffset() * 60000)
   - moveRightOffetInHours *3600000;
var d =  new Date(ms);

var bandInfos = [
  Timeline.createBandInfo({
   eventSource:    eventSource,
   date:           d,
...
One major advantage of using JSON to keep the time events is that they are accessible as a JavaScript array object. To support viewing the output of arbitrary queries, it is convenient to have the JavaScript in the HTML center the display on the most recent time event on the Timeline. Although getting at the date is quite easy, unfortunately, we have to poke around in some private areas of the Timeline API to do this, which requires a call to layout() in order for the Timeline to update its labels to reflect the time change. This is shown in Listing 13. The Timeline is shown in Figure 3.

Figure 3. Planet GNOME on a Timeline
Listing 13. Focus the timeline on the most recent blog post.
function onLoad() {
 ...
 tl.loadJSON("planet.json", function(json, url) {

  if( json.events.length ) {
    var td = Timeline.DateTime.parseIso8601DateTime(
                json.events[0].start);
    tl._bands[0]._ether.setDate( td );
    tl._bands[1]._ether.setDate( td );
  }
  eventSource.loadJSON(json, url);
  tl.layout();
 });
...Evolution supports time events on a calendar display. Because Timeline is lightweight and completely browser-based it also can be used on many pocket-sized devices. It might be handy to export your Evolution calendar information into a Timeline file to take on the road with you.
I'm using Evolution version 2.6.3; later versions may have fixed some of the following issues.
To export your Evolution calendar, right-click on On This Computer/Personal, and choose Save to disk. There are two ways to arrive at an RDF result: directly exporting as RDF and exporting to iCalendar format and converting that to RDF later.
The major problem in exporting events from Evolution is exporting recurring events. In a direct RDF export, only the first instance of a recurring event will be present in the result. In an iCalendar export, you will have an RRULE tag for the event that contains the information about the recurrence. Unfortunately, the w3.org's fromIcal.py (which converts iCalendar to RDF) is confused by this RRULE.
When exporting directly to RDF, you might encounter the use of the deprecated RDF feature of not explicitly namespacing the rdf:about tag. Jena provides warnings about the implicit namespacing, and unfortunately, they are on stdout instead of stderr. We want stdout to contain only a valid RDF document from our query. The little bit of sed at the top of the commands in Listing 14 will properly namespace the about tag and thus silence Jena. The mycal.rdf is exported from Evolution.
Listing 14. Namespace the about tags using stdout.
$ sed 's/<Vevent about=/<Vevent rdf:about=/g' \
   mycal.rdf >|mycal-clean.rdf
$ java jena.sparql \
   --data mycal-clean.rdf \
   --query  evolution-to-timeline.rq \
   --results xml >| evolution.xml
$ xsltproc sparql2timeline.xsl evolution.xml \
   | tr '\n' ' '  >| evolution.json
The SPARQL query shown in Listing 15 uses the same names in the SELECT clause as the blog query SPARQL. Because many calendar events will have a duration, I have added the enddate to the SELECT clause.
By using the same names in the SELECT clause, we can use the same sparql2timeline.xsl file with a few minor modifications to produce our JSON data for the Timeline. The differences to sparql2timeline.xsl are shown in Listing 16.
Listing 15. SPARQL Query for Evolution Calendars (evolution-to-timeline.rq)
PREFIX rdf: <http://www.w3.org/1999/02/22-rdf-syntax-ns#>
PREFIX dc: <http://purl.org/dc/elements/1.1/>
PREFIX ical: <http://www.w3.org/2002/12/cal/ical#>

SELECT distinct ?uid ?title ?date ?enddate ?description
WHERE {

  ?x ical:uid     ?uid .
  ?x ical:summary ?title .
  ?x ical:dtstart ?date .
  ?x ical:dtend   ?enddate .
  ?x ical:description ?description

}
ORDER BY DESC(?date)
Listing 16. A Slight Modification to sparql2timeline.xsl to Translate Evolution Calendar Data to JSON
...
<xsl:variable name="date">
  ...
</xsl:variable>
<xsl:variable name="enddate">
  <xsl:call-template name="escape">
  <xsl:with-param name="text"
 select="res:binding[@name='enddate']/res:literal"/>
  </xsl:call-template>
</xsl:variable>
...
</xsl:variable>
 {'start': '<xsl:value-of select="$date" />',
 'end': '<xsl:value-of select="$enddate" />',
 'title': '<xsl:value-of select="$title" />',
...
The driving HTML file can simply be a copy of the planet.html, modified to include evolution.json instead of planet.json.
Filesystem information could be written directly to an XML Timeline file as was done in the syslog section above. Generating RDF from filesystem searches allows you to use different SPARQL queries at a later time to refine your Timeline.
The results of the find command can be turned into RDF quickly with Perl and Redland. The Redland library follows the ./configure; make; make install; three-step process. Installing the Perl bindings requires that you configure the bindings package enabling the Perl wrapper, as shown in Listing 17.
Listing 17. Installing Redland Perl Bindings
tar xzvf redland-bindings-1.0.4.1.tar.gz
cd redland-bindings-1.0.4.1
./configure  --with-perl
cd ./perl
make
make install
The script shown in Listing 18 transforms null-separated output from a find invocation into an RDF file. The inode for each file forms the subject in the output RDF. The metadata for each file is associated with its inode subject. A few things of note: I create a shortened version of basename to serve as the label on the Timeline, and the mtime is converted into a string representation in RDF. Currently, Timeline doesn't display any label for time event labels that are too long. Also, the description will show the file's contents in the click bubble for each event.
Listing 18. Glue to Transform find Results to RDF
#!/usr/bin/perl

use POSIX;
use File::Basename;
use RDF::Redland;

$storage=new RDF::Redland::Storage(
 "hashes", "test", "new='yes',hash-type='memory'");
$model=new RDF::Redland::Model($storage, "");

$rdfns = "http://witme.sf.net/rdf/filesystem/";

$/="\0";
while( <> ) {
 $url=$_;
 # remove pesky null char at end-of-string
 chomp($url);
 ($dev, $ino, $mode, $nlink, $uid,$gid,$rdev,
   $size,$atime,$mtime,$ctime) = lstat($_);

 $model->add(
  new RDF::Redland::URI( "${rdfns}${ino}" ),
  new RDF::Redland::URI( "${rdfns}inode" ),
  new RDF::Redland::LiteralNode( "$ino" ) );
 $model->add(
  new RDF::Redland::URI( "${rdfns}${ino}" ),
  new RDF::Redland::URI( "${rdfns}url" ),
  new RDF::Redland::LiteralNode( "$url" ) );
 $model->add(
  new RDF::Redland::URI( "${rdfns}${ino}" ),
  new RDF::Redland::URI( "${rdfns}basename" ),
  new RDF::Redland::LiteralNode(basename("$url")));
 $model->add(
  new RDF::Redland::URI( "${rdfns}${ino}" ),
  new RDF::Redland::URI( "${rdfns}title" ),
  new RDF::Redland::LiteralNode(
   substr basename("$url"), 0, 25 ) );
 $model->add(
  new RDF::Redland::URI( "${rdfns}${ino}" ),
  new RDF::Redland::URI( "${rdfns}mtime" ),
  new RDF::Redland::LiteralNode( strftime(
   "%Y-%m-%d %H:%M:%S", localtime($mtime)) ) );
 $model->add(
  new RDF::Redland::URINode( "${rdfns}${ino}" ),
  new RDF::Redland::URINode( "${rdfns}size" ),
  new RDF::Redland::LiteralNode( "$size" ) );
 $model->add(
  new RDF::Redland::URI( "${rdfns}${ino}" ),
  new RDF::Redland::URI( "${rdfns}content" ),
  new RDF::Redland::LiteralNode( "$url<br>" ) );

 $desc = "<a href=\"${url}\">$url</a><br></br>"
 . "<iframe src=\"${url}\" "
 . "width=\"95%\" height=\"75%\"></iframe>";
 $model->add(
  new RDF::Redland::URI( "${rdfns}${ino}" ),
  new RDF::Redland::URI( "${rdfns}description" ),
  RDF::Redland::Node->new_xml_literal( $desc ) );
}

$model->sync();
print $model->to_string() , "\n";
The SPARQL query is shown in Listing 19. The sparql2timeline.xsl can be reused from any of the above examples. The commands also are very similar, as shown in Listing 20. The evolution.html can be copied to filesystem.html and modified to include filesystem.json, and we have a new Timeline.
Listing 19. SPARQL to Query an RDF Store for Filesystem Data
PREFIX rdf: <http://www.w3.org/1999/02/22-rdf-syntax-ns#>
PREFIX dc: <http://purl.org/dc/elements/1.1/>
PREFIX fs: <http://witme.sf.net/rdf/filesystem/>

SELECT distinct ?uid ?title ?date ?description
WHERE {


  ?x fs:inode       ?uid .
  ?x fs:title       ?title .
  ?x fs:mtime       ?date .
  ?x fs:description ?description .

}
ORDER BY DESC(?date)
Listing 20. My File Modifications for This Week
$ find ~ -name ".*" -prune -o -name "*~" -prune \
  -o -mtime -7 -print0 | \
  ./find-to-rdf.pl >| filesystem.rdf
$ java jena.sparql \
   --data filesystem.rdf \
   --query  filesystem-to-timeline.rq \
   --results xml >| filesystem.xml
$ xsltproc sparql2timeline.xsl filesystem.xml \
   | tr '\n' ' '  >| filesystem.json
Using RDF and SPARQL can be a great advantage when creating Timelines for new data sources. The sparql2timeline.xsl file can be reused to convert SPARQL query results to JSON. The two main things required are getting the data into RDF and the SPARQL query itself. I've touched on only some possibilities of SPARQL in this article. With SPARQL, it's easy to ensure that a value in the results matches a regular expression or has some other property, such as being between two dates. Results can come from multiple data sources using the UNION keyword. For example, it is easy to combine any of the above SPARQL queries into a single query to show multiple types of time events on a single Timeline.
Resources for this article: /article/9463.
Ben Martin has been working on filesystems for more than ten years. He is currently working toward a PhD at the University of Wollongong, Australia, combining Semantic Filesystems with Formal Concept Analysis to improve human-filesystem interaction.
