
Emacs Mode for GDB
The GNU symbolic debugger, GDB, is a powerful development tool, but one drawback is it works only from the command line. GDB has some clever features that make it easy to use on the command line, such as completion of GDB command names and procedure names; using Enter to repeat the previous command, which is useful for stepping through a program or looking at a listing; and the read-line interface.
For some tasks, however, it is useful have a graphical user interface (GUI). Graphical front ends are available for GDB, including Insight, but they require a separate editor. Until now, Emacs used a mode that originally was written by Eric Raymond in 1992. This comprised of the GUD buffer, where GDB commands were entered as though on the command line, and the source buffer, where a arrow string ("=>") pointed to the current line of program execution. In this article, I describe a new mode, which I call GDB-UI, that is a part of the next release of Emacs (21.4) and offers the GUI features of many modern debuggers. The advantage of this mode over the other debuggers is the powerful features of Emacs are available for tasks such as editing and searching to provide a truly integrated development environment.
Eric Raymond wrote gud.el, a grand unified debugger mode for running GDB and other debuggers, as part of Emacs. Shortly afterwards, Tom Lord and Jim Kingdon, then working at Cygnus, wrote another mode and called it gdba.el. Their mode was derived from gud.el but was designed for use only with GDB, with which it was distributed.
With gud.el, when GDB ran under Emacs, it used the -fullname option, which made it print a tag, called an annotation, that supplied the current filename, line number and address each time execution stopped. Lord and Kingdon added more annotations to GDB so that a front-end, such as Emacs, could understand better the state of execution. They called this mechanism level 2 annotations, the fullname option being level 1. This allowed Emacs to display more information, including the call stack, local variables of the current stack and the status of any breakpoints. In my opinion, this was a significant improvement, but for some reason their work didn't make its way into the Emacs community. Instead, it fell into disuse and was removed from the GDB distribution. Many GDB users may not have been aware of its existence, however, as it was distributed only with the source code for GDB.
By the time I first came across gdba.el, there had been many developments in Emacs. Notably, it had a toolbar and a speedbar. In addition, the CVS version became available, at Savannah, allowing images to be placed in the fringe to provide breakpoint icons. The resulting file, called gdb-ui.el, tries to use all of these features as well as those in gdba.el. It is stored in the lisp/progmodes sub-directory alongside gud.el.
The following simple program is used to illustrate how GDB-UI works.
myprog.c
1  typedef struct {
2    float a;
3    float b;
4  } substruct;
5
6  struct {
7    int i;
8    substruct r;
9  } c;
10
11 main() {
12   int n = 4;
13   int m[10] = {0,1,4,9,16,25,36,49,64,81};
14   n = 5;
15   myproc(n);
16   c.i = 1;
17   c.r.a = 0.5;
18   c.r.b = 0.25;
19 }
myproc.c
1  myproc(n)
2  {
3    int p;
4    p = 2*n;
5    printf("Two times %d is %d\n", n, p);
6  }
Compile with the -g option:
cc -g -c myproc.c
cc -g -o myprog myprog.c myproc.o
Type M-x gdb in the minibuffer to invoke GDB-UI. If necessary, type in the name of the executable, myprog, and press Enter. Emacs displays the GUD buffer, as it did in previous versions of Emacs. Now set the variable gdb-many-windows to t, either by selecting the checkbox on the menubar (Gud -> GDB-UI-> Display other windows) or through the minibuffer.
Emacs now displays the source code of the main routine, together with the GUD, locals, breakpoint and stack buffers, in a single frame. For the purposes of this tutorial, this arrangement is assumed. More generally, however, if the lisp variable, gdb-many-windows is nil, these other buffers appear only if the user specifically requests them. To do this, select GDB-windows or GDB-Frames from the menubar under the heading GUD and then choose the desired buffer.
If the toolbar is not present, type M-x toolbar-mode. Move the cursor slowly over the icons, and a tooltip tells you what function each button performs. Most of these icons have been taken from the Cygnus Insight debugger, but some are new. In particular, note that the Stop and Go buttons do not stop and start the program but set and clear breakpoints.

Figure 1. The Toolbar
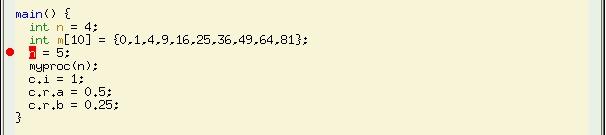
Figure 2. The Source
At line 14 of the source buffer, left-click in the fringe and a red disk appears. This shows that a breakpoint has been set there. Left-click at the same place again to clear the breakpoint, and observe the disk disappear. The breakpoint also can be set by typing break 14 in the GUD buffer or by leaving the cursor on line 14 and clicking on the Stop button in the toolbar. Try this and then clear the breakpoint again, either by typing clear 14 in the GUD buffer or by leaving the cursor on line 14 and clicking on the Go button in the toolbar.
Set this breakpoint again and another one by typing break myproc in the GUD buffer, and look at the breakpoints buffer. This buffer shows the status of all the breakpoints and is shown in Figure 3 in its own frame.
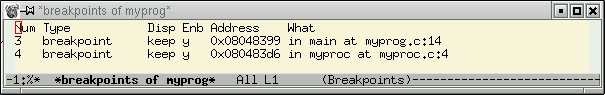
Figure 3. Status of Breakpoints
Position the cursor on the details of the first breakpoint and press the spacebar. Doing this disables the breakpoint, and the breakpoint icon turns grey. Press the spacebar again, and the breakpoint once again is enabled. Right-click on the second breakpoint and the source buffer visits the file containing the breakpoint and displays its location.
With the breakpoint set, click on the Run button, which displays a man running, to start the program. A small arrow appears over the breakpoint icon at line 14, indicating that execution has stopped there.
Look at the locals buffer, and you can see that the value of the local variable n is 4. All local variable that are simple types display their values in this buffer. Complex types, such as arrays, structures and unions, simply give their type as shown in the Figure 4. This is the case for the variable m, which is an array.
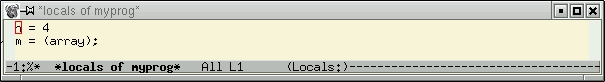
Figure 4. Locals Buffer
Place the cursor on the array name--m, in this case--and click on the button showing a pair of glasses. If it is not present already, the speedbar should appear and display the array name and type. Note, however, that this feature requires GDB 6.0 or later.

Figure 5. Watch Expressions
Complex data types are represented in the speedbar in a tree format. To see all the values of m, right-click on the tag to the left of the expression. Click there again to contract this expression. These expressions are called watch expressions, and they update whenever a value changes. They should not be confused with watchpoints, which can stop the execution of the program being run under GDB. Structures such as the global variable c have a deeper level of nesting than arrays do, and their values can be explored in a similar manner.
Display the local variable n as a watch expression in the same way, and then step over one statement of myprog using either the toolbar or the GUD buffer. Notice that the font colour of this expression and value turns red to alert you that it has changed.
Resume execution of myprog, which now should stop at myproc. You can go up and down the stack using the toolbar or the GUD buffer. The source buffer updates accordingly, as does the locals buffer. You also can select the frame that you want to examine by right-clicking it in the stack buffer. This buffer displays the call stack, with the current frame displayed in inverse video.
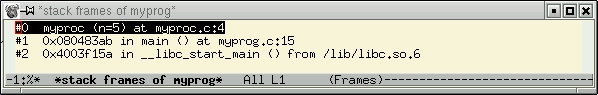
Figure 6. The Stack Buffer
When you have finished debugging, kill the GUD buffer with C-x k, which also kills all the associated buffers. You need not do this if you wish to edit the source code and recompile within Emacs. This has the the advantage of keeping the shell history of the GUD buffer as well as GDB's breakpoints. You need to check, however, that the breakpoints in the recently edited code are where you want them.
This tutorial has covered the most basic features of GDB-UI. Other buffers exist and are left to the reader to explore. They include:
Input/Output Buffer: if the lisp variable gdb-use-inferior-io-buffer is non-nil, the executable program being debugged takes its input and displays its output here. Some of the commands from shell mode are available here.
Assembler Buffer: displays the current frame as machine code. An overlay arrow points to the current instruction, and you can set and remove breakpoints as with the source buffer. Breakpoint icons also appear in the fringe or margin.
Threads Buffer: displays a summary of all threads currently in your program. Point to any thread in the list and press Enter to make it become the current thread; it then displays the associated source in the source buffer. Alternatively, right-click to make the selected thread become the current one.
Registers Buffer: displays the values held by the registers.
You may not want to use all of the features described in this article, but many of them are customisable. Please refer to the Emacs Info manual, which is included in the distribution, for more details.
Richard Stallman is the original author of both Emacs and GDB, and at the start of the GNU Project, both programs were distributed on the same tape. Each program has become more complex and now has its own repositories, developers and mailing lists. However, there is a natural relationship between the editor and the debugger, and the mode I have described here tries to re-inforce this idea.
Nick Roberts worked for 20 years as a research engineer for a major aerospace company in the United Kingdom. He recently moved to New Zealand with his family for a better quality of life. Nick can be reached at nickrob@snap.net.nz.

