
Kernel Korner: The Linux Test Project
The Linux Test Project (LTP) was developed to improve the Linux kernel by bringing automated testing to kernel design. Prior to the LTP, no formal testing environment was available to Linux developers. Although most developers unit-tested the effects of their own enhancements and patches, systematic integration testing did not exist. The LTP's primary goal is to provide a test suite to the Open Source community that helps to validate the reliability, robustness and stability of the Linux kernel. The suite tests kernel function and regression, with and without stress. The LTP is not a performance benchmark, but benchmarks often are used to drive the kernel during testing.
The LTP began as 100 test programs developed by SGI. Now, through the joint efforts of SGI, IBM, OSDL, Bull, Wipro Technologies and individual Linux developers, the LTP contains over 2,500 test programs, also called test cases, and a number of automation tools. The LTP supports multiple architectures, including x86, IA32/64, PPC32/64, and 32- and 64-bit s/390.
Although other test suites and projects exist, the LTP includes an environment for defining new tests, integrating existing benchmarks and analyzing test results. The Software Testing Automation Framework (STAF/STAX) is an open-source system that allows you to plan, distribute, execute and collect test results from a large pool of multiplatform test hosts. STAF/STAX also provides a powerful GUI-monitoring application that allows you to interact with and monitor the progress of your jobs. Test-coverage visualization tools let you see how much of a test's source code is executed by the kernel.
The IBM Linux Technology Center (LTC) has played a key role in using the LTP to uncover defects in the Linux kernel. Using the LTP, the LTC has tested more than 50 new kernel versions and found more than 500 defects. As covered in Linda Scott's whitepaper (see the on-line Resources), a typical kernel test cycle uses the LTP for focus testing to isolate and validate Linux component and application stability. This includes regression testing on new kernels to ensure they meet the functionality of previous kernels. Integration testing then validates component interaction, driven by macro-benchmark workloads. Finally, reliability and stress testing validate systemic robustness with extended duration tests (96 hours to 30 days).
The remainder of this article describes how to download and run the LTP test suite using the automation tools. We also discuss some LTP tools that can be used to help improve kernel development and testing.
The tests cover a wide range of kernel functions, including system calls, networking and filesystem functionality. The basic building block of the test suite is a test program that performs a sequence of actions and verifies the outcome. The test results usually are restricted to PASS or FAIL. Together, all the test programs and tools make up the LTP package.
The LTP is a GPL package and is available from SourceForge.net. A stable version of the LTP test suite source, ltp-yyyymmdd.tgz is released monthly. As of this writing, the latest version is ltp-20040405. After downloading the package, extract and install as follows:
tar zxf ltp-20040405.tgz
cd ltp-20040405
make
make install
You need root access to perform that last step and also to run the test suite. The test suite also is available in binary and source RPM format. For those of you who like living on the edge, development snapshots can be downloaded through anonymous CVS (see Resources).
Once installed, a number of options are available for running the LTP test suite. The most popular method is to use the runalltests.sh script, which executes about 800 of the original tests. The tests not included in runall are destructive, require monitoring or for some other reason cannot be automated. The runall script has a default behavior to run a single iteration of the test suite and produce verbose screen output. This output can be omitted with the quiet option (-q). As a simple introduction, we ignore the screen information for now and use the -l logfile_name and -p options to generate human-readable log results.
The test cases are executed by the test driver called Pan. Pan, included in the LTP package, is a lightweight driver used to run and clean up test programs. The runalltests script calls Pan to execute a set of test cases or a single test case. You can execute a set of test cases by providing runalltests with a -f scenario file. A scenario file is a simple ASCII text file that contains two columns. The first column has the name of a test case, and the second column has the command to be run. Comments start with a pound sign. For example:
# Testcase to test mmap function of the kernel
testcase1       mmap3 -l 100 -n 50

# Testcase to stress the kernel scheduler
testcase2       sched_stress.sh
The test driver uses the exit value of the test case to decide success or failure of a test. If the test case exits with a non-zero value, Pan records this as FAIL. If the test case exits with a value zero, the driver records it as PASS.
The simplest use of the test suite is to run it on your system to ensure that there are no failures:
runalltests.sh -l log -p -o output
For known failures, the LTP package includes an explanation and pointers to places for more information. Below is the partial log file from running ltp-20040506 on a 2.6.3 kernel:
Test Start Time: Mon May 17 14:20:45 2004
-----------------------------------------
Testcase                       Result     Exit Value
--------                       ------     ----------
abort01                        PASS       0
accept01                       PASS       0
access01                       PASS       0
...
rwtest01                       PASS       0
rwtest02                       PASS       0
rwtest03                       FAIL       2
rwtest04                       FAIL       2
rwtest05                       PASS       0
iogen01                        PASS       0
...
-----------------------------------------------
Total Tests: 797
Total Failures: 6
Kernel Version: 2.6.3-gcov
Machine Architecture: i686
Hostname: ltp2
In this partial log, 797 tests were run and six failed. rwtest03 and rwtest04 are I/O tests that failed due to mmap running out of resources. This problem has been resolved. The remaining failures, not shown in the log, are described below:
setegid01: verify that setegid does not modify the saved gid or real gid—failed because of a bug in glibc 2.3.2.
dio18,dio22: I/O testing—failed because of data comparison mismatch.
nanosleep02: verify that nanosleep will suspend and return remaining sleep time after receiving signal—failed due to lack of microsecond clock precision.
Writing test programs is fairly straightforward. The test cases are written in ANSI C and BASH and use the LTP Application Program Interfaces (APIs) provided by the LTP library libltp to report test status. Templates are provided that show you how to develop test cases using libltp. The test cases can use the interface to print results messages, break out of testing sequence and report a test status such as PASS or FAIL. Manual pages for using these APIs are provided in the test suite package and also on the LTP Web site. For more on the esoteric uses of LTP and a tutorial on developing tests that can be included in the LTP, see the Iyer and Larson papers in Resources.
Although not required to run the test suite, the LTP has a number of related tools and projects that facilitate test automation. Two of these projects are the Software Testing Automation Framework (STAF/STAX) and the Open Source Development Lab (OSDL) Test Platform.
LTC uses STAF/STAX to manage a pool of test machines. Using the STAF/STAX Web interface you can find and configure test machines, then run and monitor any set of test programs and return the results. STAF is an open-source, multiplatform, multilanguage testing framework. It is based on the concept of reusable services, such as process control, logging and event handling that automate testing activities. At its core, STAF is a message routing dæmon that maintains a network of local and remote services and routes requests to those services. A network of STAF-enabled machines is built by running STAF clients on dedicated networked hosts. STAX is a GUI-based execution engine built on STAF, XML and Python. It provides an interface for testers to distribute, execute and process test results.
The OSDL Scalable Test Platform provides a framework for developers to execute tests against specific kernels and kernel patches through a Web-based interface. LTP is one of the tests that OSDL executes. Using the Web interface, you also can search for historic test results. The LTP Web site has detailed information regarding this framework.
The often unspoken assumption with software testing is that the test cases cover a majority of the software source code written. A test covers a line of code if running the test executes the line. Coverage analysis measures how much of the target code is run during a test and is a useful mechanism for evaluating the effectiveness of the LTP test suite. Given two test cases that run successfully, the test with the higher code coverage provides somewhat more assurance that the code is bug-free. Of course, bugs still may exist in the untested code, and even 100% coverage does not guarantee bug-free code.
Cornett's paper provides a good introduction to the many types of coverage. We've based the LTP coverage on the GCC compiler that provides statement and branch coverage. As stated earlier, statement coverage reports which lines of the source code are executed. Branch-conditional coverage reports which Boolean conditions in a control statement, such as “if” or “while”, are tested and taken. In the code below, branch-conditional coverage would tell us when the branch was taken, statement1 executed, and when it was due to condition1 or condition2 being true:
if ( condition1 || condition2 )
    statement1;
else
    statement2;
GCC coverage works by passing the options -fprofile-arcs -ftest-coverage to the compiler and the GCOV program that processes coverage data. GCOV produces a source file annotated with the number of times each line of code and branch condition was executed. GCC coverage was intended originally for user-space programs and needed to be adapted for the kernel because coverage data is produced only when a program terminates, which the kernel never does.
Also, because the kernel is not linked with standard C libraries, many of the GCOV structures are not present in the kernel. The LTP has published a GCOV-kernel patch to the Linux kernel that addresses these issues and allows developers to use the existing GCOV tools to gather coverage data from a running kernel. Installation instructions as well as a detailed description of the functionality provided by the patch can be found at the LTP Web site and in an Ottawa Linux Symposium paper by Paul Larson and others.
The GCOV-kernel patch is published on the LTP Web site as a separate package, but it is included in the LTP development tree. In addition to kernel code changes, when installed, the patch configures the Makefiles to pass the coverage options to GCC when the kernel is compiled. The coverage options instruct the compiler to generate code and data structures to capture information that is used to determine which lines of kernel code were executed. The user-space tool GCOV combines the source files and the files generated by running a GCOV-enabled program—in our case this is the kernel—to produce a new source code file with the count for each line of C code, representing the number of times the line was executed. Because the program output needed for GCOV is not created until the program ends, and the kernel does not terminate, the patch also creates a /proc/gcov/... tree that GCOV can use at any time to get counter data from the kernel.
To facilitate coverage analysis further, the LTP has developed a utility, LCOV, to create more useful graphic GCOV output. LCOV can be downloaded from the GCOV-kernel Web site. LCOV automates the process of extracting the coverage data from the kernel, running GCOV and producing HTML. Once the GCOV-kernel patch is applied and compiled, the coverage system can be used as follows.
First, load the gcov-proc kernel module:
insmod gcov-proc.o
Clear the GCOV counters:
lcov --reset
Run the LTP test suite or your favorite test program next, then capture GCOV data:
lcov -c -o coverage.info
Create the HTML coverage tree:
genhtml coverage.info
genhtml is one of the LCOV tools and generates HTML output at both the directory and file level, as illustrated in Figures 1 and 2. Figure 1 is a partial screenshot of the Linux kernel source subdirectory. In this example, the total amount of code covered for the directory is 47.3%. Each line shows a filename. A color-coded meter is used to represent the amount of coverage for the file: green for files with 50% coverage or greater, yellow for files with coverage between 10% and 50% and red for files with less than 10% coverage. The last two columns show the percent coverage for the file and number of lines executed over the total number of lines instrumented. Both figures are displayed on a color-coded background. Figure 2 is a partial view of a printk.c file. This is a graphical view of the original GCOV output. A similar color coding is used to allow you to identify under-utilized code quickly. At this time, LCOV output shows only statement coverage and not branch coverage.

Figure 1. genhtml produces a code coverage report from GCOV data.
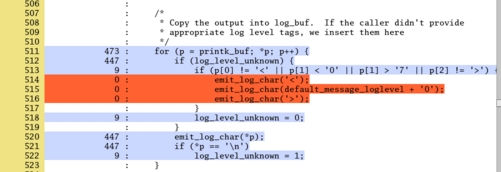
Figure 2. Color codes show under-utilized code in the source file.
As Linux plays an increasing role in the enterprise computing space, robustness and reliability requirements have led to more formal testing methods. The LTP is a functional regression testing suite used to help improve Linux reliability. For any kernel development project, running the LTP test suite gives you a method to help ensure your changes don't break the kernel. As you test your kernel modifications, a GCOV-enabled kernel and accompanying LTP tools will help you visualize the effectiveness of your testing and help focus the test team on areas with low coverage.
In addition to test results that show kernel regressions and code coverage gaps, the LTP and coverage analysis potentially provide a method for measuring kernel improvement over time. Consider the simple argument: combined with higher coverage of the kernel code, fewer kernel failures suggest that Linux kernel reliability is improving. A study of how well LTP tracks improvement in Linux is part of our future work.
Finally, we would like to encourage developers to submit their tests to be included in the LTP suite. As always, suggestions and comments are welcome, and should be sent to the mailing lists found on the LTP Web site.
Resources for this article: /article/7809.
Nigel Hinds is a member of the technical staff at IBM T. J. Watson Research Center. He develops testing tools and maintains the kernel coverage system for the Linux Testing Project. His other interests include networking and distributed systems. He can be reached at nhinds@us.ibm.com.

