
Ten Commands Every Linux Developer Should Know
This article presents a list of commands you should be able to find on any Linux installation. These are tools to help you improve your code and be more productive. The list comes from my own experience as a programmer and includes tools I've come to rely on repeatedly. Some tools help create code, some help debug code and some help reverse engineer code that's been dumped in your lap.
Those of you addicted to integrated development environments (IDEs) probably never heard of this tool, or if you did you probably think it's obsolete. But a tags-aware editor is a productive programming tool.
Tagging your code allows editors like vi and Emacs to treat your code like hypertext (Figure 1). Each object in your code becomes hyperlinked to its definition. For example, if you are browsing code in vi and want to know where the variable foo was defined, type :ta foo. If your cursor is pointing to the variable, simply use Ctrl-right bracket.
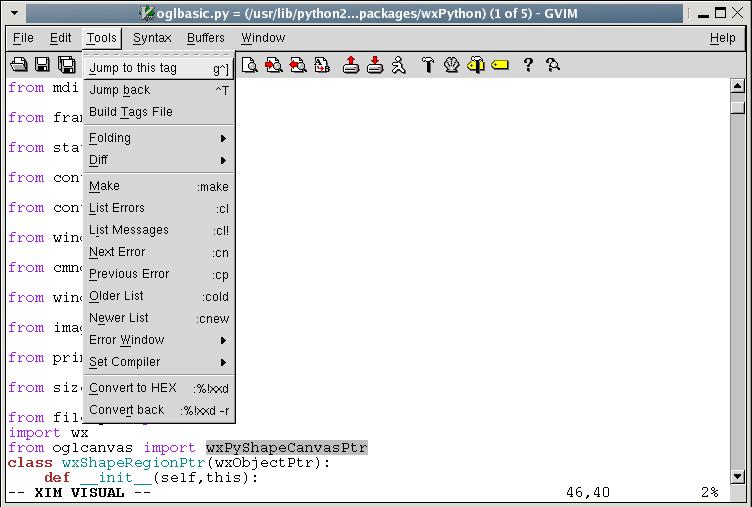
Figure 1. gvim at Work with Tags
The good news for the vi-impaired is ctags is not only for C and vi anymore. The GNU version of ctags produces tags that can be used with Emacs and many other editors that recognize tag files. In addition, ctags recognizes many languages other than C and C++, including Perl and Python, and even hardware design languages, such as Verilog. It even can produce a human-readable cross-reference that can be useful for understanding code and performing metrics. Even if you're not interested in using ctags in your editor, you might want to check out the human-readable cross-reference by typing ctags -x *.c*.
What I like about this tool is that you get useful information whether you input one file or one hundred files, unlike many IDEs that aren't useful unless they can see your entire application. It's not a program checker, so garbage in, garbage out (GIGO) rules apply.
strace lets you decipher what's going on when you have no debugger nor the source code. One of my pet peeves is a program that doesn't start and doesn't tell you why. Perhaps a required file is missing or has the wrong permissions. strace can tell you what the program is doing right up to the point where it exits. It can tell you what system calls the program is using and whether they pass or fail. It even can follow forks.
strace often gives me answers much more quickly than a debugger, especially if the code is unfamiliar. On occasion, I have to debug code on a live system with no debugger. A quick run with strace sometimes can avoid patching the system or littering my code with printfs. Here is a trivial example of me as an unprivileged user trying to delete a protected file:
strace -o strace.out rm -f /etc/yp.conf
The output shows where things went wrong:
lstat64("/etc/yp.conf", {st_mode=S_IFREG|0644,
st_size=361, ...}) = 0
access("/etc/yp.conf", W_OK) = -1 EACCES
(Permission denied)
unlink("/etc/yp.conf") = -1 EACCES (Permission
denied)
strace also lets you attach to processes for just-in-time debugging. Suppose a process seems to be spending a lot of time doing nothing. A quick way to find out what is going on is to type strace -c -p mypid. After a second or two, press Ctrl-C and you might see a dump something like this:
% time    seconds  usecs/call     calls    errors  syscall
------ ----------- ----------- --------- --------- ----------------
 91.31    0.480456        3457       139           poll
  6.66    0.035025         361        97           write
  0.91    0.004794          16       304           futex
  0.52    0.002741          14       203           read
  0.31    0.001652           3       533           gettimeofday
  0.26    0.001361           4       374           ioctl
  0.01    0.000075           8        10           brk
  0.01    0.000064          64         1           clone
  0.00    0.000026          26         1           stat64
  0.00    0.000007           7         1           uname
  0.00    0.000005           5         1           sched_get_priority_max
  0.00    0.000002           2         1           sched_get_priority_min
------ ----------- ----------- --------- --------- ----------------
100.00    0.526208                  1665           total
In this case, it's spending most of its time in the poll system call—probably waiting on a socket.
The name is a mnemonic for file user and tells what processes have opened a given file. It also can send a signal to all those processes for you. Suppose you want to delete a file but can't because some program has it open and won't close it. Instead of rebooting, type fuser -k myfile. This sends a SIGTERM to every process that has myfile opened.
Perhaps you need to kill a process that forked itself all over the place, intentionally or otherwise. An unenlightened programmer might type something like ps | grep myprogram. This inevitably would be followed by several cut-and-paste operations with the mouse. An easier way is to type fuser -k ./myprogram, where myprogram is the pathname of the executable. fuser typically is located in /sbin, which generally is reserved for system administrative tools. You can add /usr/sbin and /sbin to the end of your $PATH.
ps is used to find process status, but many people don't realize it also can be a powerful debugging tool. To get at these features, use the -o option, which lets you access many details of your processes, including CPU usage, virtual memory usage, current state and much more. Many of these options are defined in the POSIX standard, so they work across platforms.
To look at your running commands by pid and process state, type ps -e -o pid,state,cmd. The output looks like this:
4576 S /opt/OpenOffice.org1.1.0/program/soffice.bin -writer
4618 D dd if /dev/cdrom of /dev/null
4619 S bash
4645 R ps -e -o pid,state,cmd
Here you can see my dd command is in an uninterruptible sleep (state D). Basically, it is blocking while waiting for /dev/cdrom. My OpenOffice.org writer is sleeping (state S) while I type my example, and my ps command is running (state R).
For an idea of how a running program is performing, type:
ps -o start,time,etime -p mypid
This shows the basic output from the time command, discussed later, except you don't have to wait until your program is finished.
Most of the information that ps produces is available from the /proc filesystem, but if you are writing a script, using ps is more portable. You never know when a minor kernel rev will break all of your scripts that are mining the /proc filesystem. Use ps instead.
The time command is useful for understanding your code's performance. The most basic output consists of real, user and system time. Intuitively, real time is the amount of time between when the code started and when it exited. User time and system time are the amount of time spent executing application code versus kernel code, respectively.
Two flavors of the time command are available. The shell has a built-in version that tells you only scheduler information. A version in /usr/bin includes more information and allows you to format the output. You easily can override the built-in time command by preceding it with a backslash, as in the examples that follow.
A basic knowledge of the Linux scheduler is helpful in interpreting the output, but this tool also is helpful for learning how the scheduler works. For example, the real time of a process typically is larger than the sum of the user and system time. Time spent blocking in a system call does not count against the process, because the scheduler is free to schedule other processes during this time. The following sleep command takes one second to execute but takes no measurable system or user time:
\time -p sleep 1
real 1.03
user 0.00
sys 0.00
The next example shows how a task can spend all of its time in user space. Here, Perl calls the log() function in a loop, which requires nothing from the kernel:
\time perl -e 'log(2.0) foreach(0..0x100000)'
real 0.40
user 0.20
sys 0.00
This example shows a process using a lot of memory:
\time perl -e '$x = 'a' x 0x1000000'

0.06user 0.12system 0:00.22elapsed 81%CPU
(0avgtext+0avgdata 0maxresident)k
0inputs+0outputs (309major+8235minor)pagefaults
0swaps
The useful information here is listed as pagefaults. Although the GNU time command advertises a lot of information, the 2.4 series of the Linux kernel stores only major and minor page-fault information. A major page fault is one that requires I/O; a minor page fault does not.
This command allows you to retrieve information on symbol names inside an object file or executable file. By default, the output gives you a symbol name and its virtual address. What good is that? Suppose you are compiling code and the compiler complains that you have an unresolved symbol _foo. You search all of your source code and cannot find anywhere where you use this symbol. Perhaps it got pulled in from some template or a macro buried in one of the dozens of include files that compiled along with your code. The command:
nm -guA *.o | grep foo
shows all the modules that refer to foo. If you want to find out what library defines foo, simply use:
nm -gA /usr/lib/* | grep foo
The nm command also understands how to demangle C++ names, which can be handy when mixing C and C++. For example, forgetting to declare a C function with extern"C" produces a link time error something like this:
undefined reference to `cfunc(char*)'
In a large project with poorly defined headers, you might have a hard time tracking down the offending module. In this case, you can look for all the unresolved symbols in each object file with demangling turned on as follows:
nm -guC *.o
extern-c.o:cfunc
no-extern-c.o:cfunc(char*)
This command looks for ASCII strings embedded in binary files. It can be used for good or for evil. The good uses include trying to figure out what library is producing that cryptic string on stdout every once in a while, for example:
strings -f /usr/lib/lib* | grep "cryptic message"
On the evil side, the character strings can be used to probe your format strings looking for clues and vulnerabilities. This is why you should never put passwords and logins in your programs. It might be wise to examine your own programs with this tool and see what a clever programmer can see. The version of strings that comes with the GNU binutils has many useful options.
These two commands do basically the same thing, but each offers slightly different features. od is used to convert a binary file to whatever format you like. When dealing with programs that generate raw binary files, od can be indispensable. Although the name stands for octal dump, it can dump data in decimal and hexadecimal as well. od dumps integers, IEEE floats or plain bytes. When looking at multibyte integers or floats, the host byte order affects the output.
xxd also dumps binary files but does not try to interpret them as integers or floats, so the host byte order does not affect the output, which can be confusing or helpful depending on the file. Let's create a four-byte file on an Intel machine:
$ echo -n abcd > foo.bin
$ od -tx4 foo.bin
0000000 64636261
0000004

$ xxd -g4 foo.bin
0000000: 61626364         abcd
The output of od is a byte-swapped 32-bit integer, and the output of xxd is a group of four bytes in the same byte order as they appear in the file. If you're looking for the string abcd, xxd is the command for you. But, if you're looking for the 32-bit number 0x64636261, od is the right command.
xxd also knows a few cool tricks that od doesn't, including the ability to format the output in binary and to translate a binary file into a C array. Suppose you have a binary file that you want to encode inside an array in your C program. One way to do this is by creating a text file as follows:
$ xxd -i foo.bin

unsigned char foo_bin[] = {
  0x61, 0x62, 0x63, 0x64
};

unsigned int foo_bin_len = 4;
UNIX and Linux have never enforced any policy of filename extensions. Naming conventions have evolved, but they are guidelines, not policies. If you want to name your digital picture image00.exe, go ahead. Your Linux photo application gladly accepts the file no matter what the name is, although it may be hard to remember.
The file command can help when you have to retrieve a file from a brain-dead Web browser, which mangles the name—say a file that should have been named foo.bar.hello.world.tar.gz comes out as foo.bar. The file command can help like this:
$ file foo.bar

foo.bar: gzip compressed data,
was "foo.bar.hello.world.tar", from Unix
Perhaps you received a distribution with a bin directory full of dozens of files, some of which are executables and some are scripts. Suppose you want to pick out all the shell scripts. Try this:
$ file /usr/sbin/*  | grep script

/usr/sbin/makewhatis:  a /bin/bash script text
executable

/usr/sbin/xconv.pl:    a /usr/bin/perl script
text executable
The file command identifies all the files in the bin directory, and the grep command filters out everything not a script. Here are some more examples:
file core.4867

core.4867: ELF 32-bit LSB core file Intel 80386,
version 1 (SYSV), SVR4-style, from 'abort'

file /boot/initrd-2.4.20-6.img

/boot/initrd-2.4.20-6.img: gzip compressed data,
from Unix, max compression

file -z /boot/initrd-2.4.20-6.img

/boot/initrd-2.4.20-6.img: Linux rev 1.0 ext2
filesystem data (gzip compressed data, from Unix,
max compression)
Just as you shouldn't judge a book by its cover, you shouldn't assume the contents of a file based on its name.
This is a more advanced tool and is not for the faint of heart. It's sort of a data-mining tool for object files. A treasure trove of information is encoded inside your object code, and this tool lets you see it. One useful thing this tool can do is dump assembly code mixed with source lines, something gcc -S doesn't do for some reason. Your object code must be compiled with debug (-g) for this to work:
objdump --demangle --source myobject.o
objdump also can help extract binary data from a core file for postmortem debug when you don't have access to a debugger. A complete example is too long for this article, but you need the virtual address from nm or obdump -t. Then, you can dump the file offsets for each virtual address with objdump -x. Finally, objdump is able to read from non-ELF file formats that gdb and other tools can't touch.
This article is not intended as a definitive reference but as a starting point to help you become more productive. Each one of these commands is well documented in the Linux man and info pages. Consult them for more information and more ideas.
Resources for this article: /article/7658.
John Fusco is a software developer with General Electric Healthcare (formerly GE Medical Systems), where he designs Linux software and device drivers for GE's Lightspeed series of Computed Tomography scanners (www.gemedicalsystems.com/rad/ct/products/light_series/index.html).
