
An Introduction to GraphViz
GraphViz is a collection of tools for manipulating graph structures and generating graph layouts. Graphs can be either directed or undirected. GraphViz offers both graphical and command-line tools. A Perl interface also is available, but it is not covered here for reasons of generality. Graphical tools are not going to be discussed in this article either. Instead, this article focuses on using GraphViz from the command line.
Some users like to use command-line tools instead of graphical ones, because command-line tools can be used with a scripting language. This means you can create scripts that create dynamic graphs. Some possible uses of dynamic graphs include:
a traceroute representation of packages going to many destinations, taking the form of a tree
database relations diagrams between tables
a graphical report for your boss, e-mailed automatically from a cron job
a Web site map
UML diagrams
RPM package dependencies on RPM-based systems
source code structure diagrams
The package is available compiled for most Linux and UNIX distributions (see Resources). It also is available in source code, so you can compile it yourself. Use your favorite method of software installation to get GraphViz on your system.
GraphViz is comprised of the following programs and libraries.
The dot program: a utility program for drawing directed graphs. It accepts input in the dot language. The dot language can define three kinds of objects: graphs, nodes and edges. dot uses a Sugiyama-style (see Resources) hierarchical layout.
The NEATO program: a utility program for drawing undirected graphs. This kind of graph commonly is used for telecommunications and computer programming tasks. NEATO uses an implementation of the Kamada-Kawai (see Resources) algorithm for symmetric layouts.
The twopi program: a utility program for drawing graphs using a circular layout. One node is chosen as the center, and the other nodes are placed around the center in a circular pattern. If a node is connected to the center node, it is placed at distance 1. If a node is connected to a node directly connected to the center node, it is placed at distance 2 and so on.
dotty, tcldot and lefty: three graphical programs. dotty is a customizable interface for the X Window System written in lefty. tcldot is a customizable graphical interface written in Tcl 7. lefty is a graphics editor for technical pictures.
libgraph and libagraph: the drawing libraries. Their presence means an application can use GraphViz as a library rather than as a software tool.
The way to execute the dot, NEATO and twopi programs must be shown. The programs have similar command-line arguments. The general method of running dot, NEATO or twopi is as follows:
toolname -Tps filename -o output.ps
This command executes the tool (toolname), states that the output should be in PostScript (using filename as input) and generate (-o) the output.ps file. Other possible command-line arguments are not be discussed here, but you can check the man pages or the GraphViz Web site (see Resources) for more information.
A graph G(V,E) is a finite, nonempty set of vertices, V, or nodes and a set of edges, E. If the edges E that have the form of (a,b) are ordered pairs of vertices, then we have a directed graph. If the edges E are unordered pairs of vertices, we have an undirected graph (see Resources).
To make a binary tree using dot, we should know the following theory. A directed graph with no cycles is called a directed acyclic graph. A directed acyclic graph is a tree if it satisfies the following properties:
There is one and only one vertex (the root), which no edges enter
Every vertex, apart from the root vertex, has only one entering edge.
There is unique path from the root to each of the vertices.
If the sons of each vertex in a tree are ordered, then the tree is called an ordered tree. A binary tree is an ordered tree such that:
Each son of a vertex is distinguished as either a left child or a right child.
Each vertex can have at most one left son and one right son.
The record argument to the shape parameter is the crucial one in this example. Also, the label parameter has some pointers (named f0, f1 and f2 - <f0>, <f1> and <f2> in the dot language code) to declare the specific parts of the records we want to connect. We use the | symbol to separate the pointers. Notice that after the definition of each node, we use the nodename: pointer to denote the part of the record to which we want to connect. See Figure 1 for the output and Listing 1 for the dot source code.

Figure 1. A Binary Tree
Listing 1. Dot Source Code for Figure 1
digraph G
{
        node [shape = record];

        node0 [ label ="<f0> | <f1> J | <f2> "];
        node1 [ label ="<f0> | <f1> E | <f2> "];
        node4 [ label ="<f0> | <f1> C | <f2> "];
        node6 [ label ="<f0> | <f1> I | <f2> "];
        node2 [ label ="<f0> | <f1> U | <f2> "];
        node5 [ label ="<f0> | <f1> N | <f2> "];
        node9 [ label ="<f0> | <f1> Y | <f2> "];
        node8 [ label ="<f0> | <f1> W | <f2> "];
        node10 [ label ="<f0> | <f1> Z | <f2> "];
        node7 [ label ="<f0> | <f1> A | <f2> "];
        node3 [ label ="<f0> | <f1> G | <f2> "];


        "node0":f0 -> "node1":f1;
        "node0":f2 -> "node2":f1;

        "node1":f0 -> "node4":f1;
        "node1":f2 -> "node6":f1;
        "node4":f0 -> "node7":f1;
        "node4":f2 -> "node3":f1;

        "node2":f0 -> "node5":f1;
        "node2":f2 -> "node9":f1;

        "node9":f0 -> "node8":f1;
        "node9":f2 -> "node10":f1;
}
A hash table is an array that holds pointers to entries indexed by hash value. Such an entry can be a memory address, a database record holding the wanted information, a certain position in a file that is the start of the wanted record and so on. Hash tables are used for searching that is easy finding purposes. For example, they often are used as indexes in DBMS systems and compilers.
The rotate=90 command in the listing below returns a landscape output page. Notice that the {} inside the label parameter tells the dot language to connect the record parts left to right instead of one above another. It is easy to draw a hash table in this way rather than using a graphical tool.
The rankdir=LR command is the crucial one in Listing 1. It tells the dot language to place nodes from left to right. See Figure 2 for the output and Listing 2 for the dot source code.
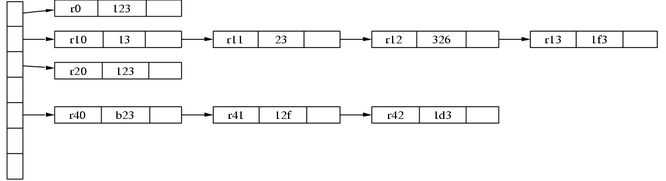
Figure 2. A Hash Table
Listing 2. Dot Source Code for Figure 2
digraph G
{
        rankdir = LR;
        node [shape=record, width=.1, height=.1];
        rotate=90;

        node0 [label = "<p0> | <p1> | <p2> | <p3> \\
                 | <p4> | | ", height = 3];

        node[ width=2 ];
        node1 [label = "{<e> r0 | 123 | <p> }" ];
        node2 [label = "{<e> r10 | 13 | <p> }" ];
        node3 [label = "{<e> r11 | 23 | <p> }" ];
        node4 [label = "{<e> r12 | 326 | <p> }" ];
        node5 [label = "{<e> r13 | 1f3 | <p> }" ];
        node6 [label = "{<e> r20 | 123 | <p> }" ];
        node7 [label = "{<e> r40 | b23 | <p> }" ];
        node8 [label = "{<e> r41 | 12f | <p> }" ];
        node9 [label = "{<e> r42 | 1d3 | <p> }" ];

        node0:p0 -> node1:e;
        node0:p1 -> node2:e;
        node2:p -> node3:e;
        node3:p -> node4:e;
        node4:p -> node5:e;

        node0:p2 -> node6:e;
        node0:p4 -> node7:e;
        node7:p -> node8:e;
        node8:p -> node9:e;

}
You can use either of the previous examples with twopi. The main reason for using twopi is it allows you to define and change easily the center item of your graph. This can be done using the center command followed by a node name at the beginning of your file. See Figure 3 for the output and Listing 3 for the twopi source code.
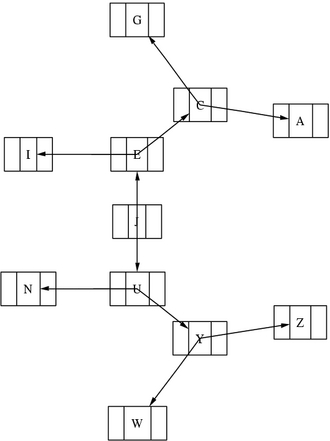
Figure 3. A twopi Graph
Listing 3. Source Code for Figure 3
digraph G
{
        center = v21;

        center -> v11;
        center -> v12;
        center -> v13;

        v11 -> v21;
        v11 -> v22;
        v11 -> v23;

        v21 -> v22;
        v22 -> v23;
        v23 -> v21;

        v21 -> v31;
        v21 -> v32;
        v21 -> v33;

        v32 -> v41;
        v32 -> v42;
        v33 -> v43;
}
Here we are going to walk through the simple task of creating a monthly calendar by using a small Perl script. See the relevant Perl code below for more information about the command-line arguments of the script.
You can experiment with sizes, colors and shapes of the output to customize the calendar and make it look the way you want. This small example simply shows what a scripting language combined with a smart tool can do. See Figure 4 for the output and Listing 4 for the Perl source code.
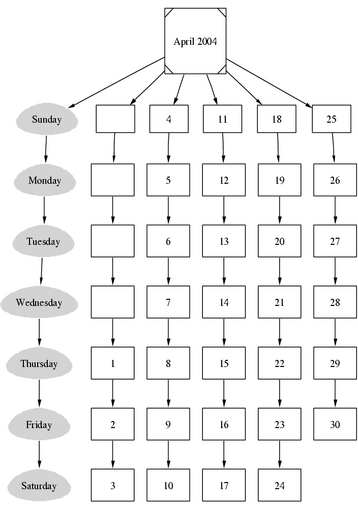
Figure 4. A Month Calendar
Listing 4. Perl Source Code for Figure 4
#!/usr/bin/perl -w

# $Id: MYdot.pl,v 3.1 2004/02/05 22:03:32 mtsouk Exp mtsouk $
#
# A perl script to generate monthly
# calendars using dot.
#
# Mihalis Tsoukalos 2004
#  * * * * * * * * * * * * * * * * * * * * * * * *

# Command line arguments
# MYdot.pl MonthName MonthYear NofDays StartingDay
#
# MonthName: This is given by the user.
# Year: This is given by the user.
# NofDays: The number of the month's days.
# Month Starting Day: 0 for Sunday etc.

die <<Thanatos unless @ARGV;
usage:
    $0 MonthName MonthYear NofDays StartingDay
    MonthName: The name of the month in the output.
    Year: The Year to appear in the output.
    NofDays: The number of the month's days.
    Month first Day: 0 for Sunday, 1 for Monday etc.
Thanatos

if ( @ARGV != 4 )
{
    die <<Thanatos
    usage info:
        Please use exactly 4 arguments!
Thanatos
}

# Get the values of the command line arguments
($MonthName, $Year, $NofDays, $SDay) = @ARGV;


# This will tell how many weeks exist in the month
$NofWeeks = (($NofDays + $SDay) / 7);
if ( $NofWeeks > int($NofWeeks) )
{
    $NofWeeks = int($NofWeeks) + 1;
}


my $filename = $MonthName.".dot";
open(OUTPUT, "> $filename " ) ||
    die "Cannot create $filename: $!\n";

$temp = $SDay;

#
# Fix the first week
#
while ( $temp > 0 )
{
    $month[$temp] = "em".$temp;
    $temp--;
}

for ( $i = 0; $i<$NofDays; $i++ )
{
    $month[$i+$SDay+1] = "day".($i+1)." ";
}

print OUTPUT <<PRE;
digraph G
{

    subgraph weekdays
    {
        node [ style=filled, color=lightgray, \\
            height=.60, width=1.15];
        sun->mon->tue->wed->thu->fri->sat;
        label = "WeekDays";
    }

    "$MonthName $Year" [shape=Msquare];
    "$MonthName $Year" -> sun;
    "$MonthName $Year" -> $month[1];
    "$MonthName $Year" -> $month[8];
    "$MonthName $Year" -> $month[15];
    "$MonthName $Year" -> $month[22];
PRE


#
# All months have at least 4 weeks (not full).
# Checking is being done here to see
# if the current months has more that 4 weeks.
#
if (defined $month[29] )
{
print OUTPUT <<WEEK5;
    "$MonthName $Year" -> $month[29];
WEEK5
}

#
# The maximum number of weeks a month can have is 6
#
if( defined $month[36] )
{
print OUTPUT <<WEEK6;
    "$MonthName $Year" -> $month[36];
WEEK6
}

for ( $i=0; $i<$NofWeeks; $i++ )
{
    print OUTPUT "subgraph week".($i+1);
    print OUTPUT "{";
    print OUTPUT "node [ height=.60, width=.85];";

    for ( $j=1; $j<7; $j++)
    {
        if (defined $month[$i*7+$j])
        {
            print OUTPUT $month[$i*7+$j];
            if (defined $month[$i*7+$j+1])
            {
                print OUTPUT " -> ";
            }
        }
    }

    #
    # The 7th day of each week is a special case
    # as it does not have a -> after.
    #
    if (defined $month[$i*7+7] )
    {
        print OUTPUT $month[$i*7+7].";\n";
    }
    print OUTPUT "}\n";
}

# Type the empty days into the output file
$temp = $SDay;
while ( $temp > 0 )
{
    print OUTPUT "em".$temp;
    print OUTPUT " [ shape=box, label=\"\" ];";
    print OUTPUT "\n";
    $temp--;
}

# Type the days into the output file
for ( $i=1; $i <= $NofDays; $i++ )
{
    print OUTPUT "\t";
    print OUTPUT "day".$i;
    print OUTPUT " [shape=box, label=\"".$i."\"];";
    print OUTPUT "\n";
}

print OUTPUT <<ENDING;

    sun [shape=egg, label="Sunday"];
    mon [shape=egg, label="Monday"];
    tue [shape=egg, label="Tuesday"];
    wed [shape=egg, label="Wednesday"];
    thu [shape=egg, label="Thursday"];
    fri [shape=egg, label="Friday"];
    sat [shape=egg, label="Saturday"];
}
ENDING

close(OUTPUT) ||
    die "Cannot close $filename: $!\n";

exit 0;
Now we are going to look at some more complex examples of what you can do with GraphViz. We start with building an entity relation diagram (used in DBMS systems) using NEATO. An entity relation diagram is a graph that represents entity sets, attributes and relationships. It is common practice to represent entity sets as rectangles, attributes as ovals and relationships as diamonds. GraphViz easily can be used to construct such diagrams, as the example below shows.
The key point to remember here is to change the shapes--rectangles, ovals and diamonds--among the different kinds of elements. This can be done with the shape attribute. See Figure 5 for the output and Listing 5 for the NEATO source code.

Figure 5. An Entity Relation Diagram
Listing 5. Source Code for Figure 5
graph G
{
    rotate=90;

    id[label="id"];
    email[label="email"];
    name[label="name"];

    uname[label="Name"];
    address[label="Address"];

    node[shape=rectangle];
    university[label="University Department"];
    student[label="Student"];

    StUnDe[shape=diamond];

    university -- StUnDe [label="1", len=3];
    StUnDe -- student [label="n", len=2];

    student -- id;
    student -- name;
    student -- email;

    university -- uname;
    university -- address;
}
Next up is the example of an undirected graph with costs on edges using NEATO. This is a useful example, because this kind of graph can be used to represent network structures, while the cost values help define the best routing tables for either local or wide area networks. It should be helpful for easily understanding network topologies. This figure has been taken from page 174 of The Design and Analysis of Computer Algorithms (see Resources). See Figure 6 for the output and Listing 6 for the NEATO source code.

Figure 6. An Undirected Graph with Costs
Listing 6. Source Code for Figure 6
graph G
{
        edge [len=2];

        V1 -- V2 [label="20"];
        V2 -- V3 [label="15"];
        V3 -- V4 [label="3"];
        V4 -- V5 [label="17"];
        V5 -- V6 [label="28"];
        V6 -- V1 [label="23"];

        V7 -- V1 [label="1"];
        V7 -- V2 [label="4"];
        V7 -- V3 [label="9"];
        V7 -- V4 [label="16"];
        V7 -- V5 [label="25"];
        V7 -- V6 [label="36"];
}
If you put the six V7 connections first, the output is not that great; at least, it is not similar to the original figure. Of course, the amount of information is the same. You can make some changes to the file and see how the output looks.
The following example presents a graphical representation of an RCS revision tree structure. Again, Perl is the programming language of choice. As you can imagine, the Perl script is not perfect in the sense that it does not cover all the possible revision tree structures. In this example, small revision trees are presented for illustration purposes. For complex revision trees, greater consideration of the specialties of the revision tree must be made when writing the Perl script.
The basic idea behind the script is to first get the output we want from the rlog command. The rlog command returns a lot of information about the change history of the file, so we have to grep the output to get the desirable data. The rlog utility is included in the RCS revision control system.
The key point in the script is to separate the revision branches by the first part of the revision number. This way, each revision branch has its own subgraph.
Notice that you have to put the quotation marks around the revision names. Otherwise, the output is not displayed properly. See Figure 7 for the output and Listing 7 for the Perl source code.
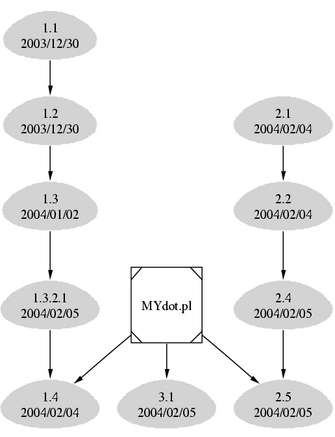
Figure 7. RCS Revision Tree Graph
Listing 7. Perl Source Code for Figure 7
#!/usr/bin/perl -w

# $Id: RCS.pl,v 1.2 2004/02/05 12:21:40 mtsouk Exp mtsouk $
#
# Command line arguments
# program_name.pl file_with_RCS_info

use strict;

my $filename="";
my $COMMAND="";
my %revision=();
# Change that according to your system
my $RLOG="/usr/bin/rlog";
my $rev=0;
my $count=0;
my %branch=();
my $date=0;

die <<Thanatos unless @ARGV;
usage:
   $0 file_with_RCS_info
Thanatos

if ( @ARGV != 1 )
{
   die <<Thanatos
      usage info:
         Please use exactly 1 argument!
Thanatos
}

# Get the file name
($filename) = @ARGV;

$COMMAND = "$RLOG $filename |";
#
# Do not forger to change the path
# of the grep command
#
$COMMAND = $COMMAND." /bin/grep ^revision -A 1 ";
open (RCSINFO, "$COMMAND |")
   || die "Cannot run the ".$COMMAND.": $!\n";

my $line = "";
my $connect="";
while ($line = <RCSINFO>)
{
   if ( $line =~ /^revision/ )
   {
      $rev = (split " ", $line)[1];
      $count = (split /\./, $rev)[0];
      if ( defined $branch{$count} )
      {
         my $number = $branch{$count};
         $number++;
         $branch{$count} = $number;
      }
      else
      {
         $branch{$count}=1;
         $connect.="\"$filename\" -> \"rev$rev\";";
      }
      $line = <RCSINFO>;
      if ( $line =~ /^date:/ )
      {
         $date = (split / /, $line)[1];
         $revision{$rev} = $date;
      }
   }
}

close(RCSINFO)
   || die "Cannot close RCSINFO: $!\n";

my $FILE = $filename.".dot";
open (OUTPUT, "> $FILE" )
   || die "Cannot create file: $!\n";

print OUTPUT <<START;
digraph G
{
   "$filename" [shape=Msquare];
   node [ style=filled, color=lightgray];
   node [ height=.50, width=.65];
START

#
# Now we will process the output of the rlog command
# We want to get the revision number,
# the date and the username
#
my $k="";
foreach $k (sort keys %revision)
{
   print "$k => $revision{$k}\n";
   print OUTPUT <<DATA;
   "rev$k" [shape=egg, label="$k\\n$revision{$k}"];
DATA
}

my $ll="";
foreach $ll (keys %branch)
{
   print OUTPUT "\t";
   foreach $k (sort keys %revision)
   {
      my $major = (split /\./, $k)[0];
      if ( $ll == $major )
      {
         my $counter = $branch{$ll};
         $counter--;
         $branch{$ll} = $counter;
         print OUTPUT "\"rev".$k."\"";
         if ( $counter > 0 )
         {
            print OUTPUT "  -> ";
         }
         else
         {
            print OUTPUT ";\n";
         }
      }
   }
}

print OUTPUT <<END;
   \t$connect
}
END

close (OUTPUT)
   || die "Cannot close file: $!\n";

exit 0;
Our next example is of a graph more commonly needed: a graphical representation of operating system directory structures. Keep in mind there is a limitation to the number of directories that can be presented, due to page dimension restrictions. This Perl script has been tested with a small number of directories. Also, the directory structure itself is the most important factor for the output quality. Meaning, if we can imagine the directory structure as a tree structure, it can make a great difference if the maximum levels of the tree are four and if the maximum levels of the tree are ten, with most of the limbs having a depth of three.
Notice that each box does not display the full path name, only the last part of the directory name. You can find the full path name by following the links. Please see the source code to understand how the script works. Keep in mind that the source code was not tested fully; it is simply presented to show what the dot language can do with a little help from a script language. See Figure 8 for the output and Listing 8 for the Perl source code.
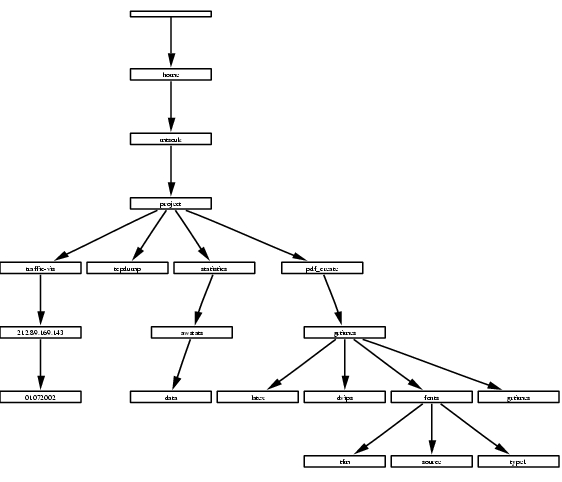
Figure 8. Directory Structure Graph
Listing 8. Perl Source Code for Figure 8
#!/usr/bin/perl -w

# $Id: DIR.pl,v 1.3 2004/02/06 15:18:13 mtsouk Exp mtsouk $
#
# Please note that this is alpha code
#
# Command line arguments
# program_name.pl directory

use strict;

my $directory="";
my $COMMAND="";
my %DIRECTORIES=();

die <<Thanatos unless @ARGV;
usage:
   $0 directory
Thanatos

if ( @ARGV != 1 )
{
   die <<Thanatos
      usage info:
         Please use exactly 1 argument!
Thanatos
}

# Get the file name
($directory) = @ARGV;

$COMMAND = "/usr/bin/find $directory -type d | ";
open (INPUT, "$COMMAND")
   || die "Cannot run the ".$COMMAND.": $!\n";

#
# The reason for putting OUTPUT in front of the
# directory name is that we
# can have . as directory name
#
my $OUTPUT="OUTPUT$directory.dot";
$OUTPUT =~ s/\//-/g;
open (OUTPUT, "> $OUTPUT")
   || die "Cannot create output file $OUTPUT: $!\n";

print OUTPUT <<START;
digraph G
{
   rotate=90;
   nodesep=.05;
   node[height=.05, shape=record, fontsize=5];
START

# Make nodes for the command line argument directory
my @split = split /\//, $directory;
my $key="";
my $prev=undef;
for $key (@split)
{
    my $KEY=$key;
    $key =~ s/[^[a-zA-Z0-9]/_/g;
    $key = $prev."_".$key;
    $prev = $key;
    print OUTPUT "\t".$prev;
    print OUTPUT " [shape=box, label=\"$KEY\"];";
    print OUTPUT "\n";
}

my $lastpart = "";
while (<INPUT>)
{
   chomp;
   my $orig=$_;

   # Get the right label
   my @split = split /\//, $_;
   $lastpart = pop @split;

   $_ =~ s/\//_/g;
   #
   # The _ is accepted as a valid node character
   # . , + - are not accepted
   #
   $_ =~ s/[^a-zA-Z0-9]/_/g;
   my @split = split /_/, $_;
   print OUTPUT "\t_".$_;
   print OUTPUT " [shape=box,label=\"$lastpart\"];";
   print OUTPUT "\n";
   $DIRECTORIES{$orig}=0;
}

my $subdir="";
my %TEMP=();
foreach $key ( sort keys %DIRECTORIES )
{
   print "KEY: $key\n";
   my @split = split /\//, $key;
   my $prev = undef;
   for $subdir (@split)
   {
      $subdir =~ s/[^a-zA-Z0-9_]/_/g;
      my $next = $prev."_".$subdir;
      # print "NEXT: $next\n";
      if ( !defined($prev) )
      {
         $prev = $next;
         next;
      }
      my $val = "$prev->$next;\n";
      # print "VAL: $val\n";
      if ( !defined( $TEMP{$val} ))
      {
         print OUTPUT "$prev->$next;\n";
      }
      $prev .= "_".$subdir;
      $TEMP{$val}=1;
   }
}

close(INPUT)
   || die "Cannot close input file: $!\n";


print OUTPUT <<END;
}
END

close (OUTPUT)
   || die "Cannot close file: $!\n";

exit 0;
Using dot, twopi and NEATO to create graphics is not difficult. The three utilities were made according to the UNIX philosophy: they are easy to use, they do one thing well and the only requirement for using them is a simple text editor.
Graphical tools that make use of dot, twopi and NEATO languages for making graphs exist as well, but I still prefer the command line. The presented tools can be used for simple graphs as well as for complex graphs.
I would like to thank Nikos Platis for proofreading the article.
"Methods for Visual Understanding of Hierarchical System Structures". Sugiyama, K., Tagawa, S. and Toda, M. Man and Cybernetics. IEEE Trans. Systems, February 1981.
A Technique for Drawing Directed Graphs. Gansner, E. R., Koutsofios, E., North, S. C. and Vo, K. IEEE Trans. Software Engineering, May 1993.
"An algorithm for drawing general undirected graphs". Kamada, T. and Kawai, S. Information Processing Letters, April 1989.
The Design and Analysis of Computer Algorithms. Aho, Hopcroft and Ullman. Addison Wesley, 1974.
Mihalis Tsoukalos lives in Greece with his wife, Eugenia, and works as a high school teacher. Previously, he worked as a UNIX systems administrator, an Oracle DBA, a UNIX programmer and a PL/SQL programmer. He holds a B.Sc. in Mathematics and a M.Sc. in Information Technology from University College, London. Mihalis can be reached at mtsouk@freemail.gr.

