
Cooking with Linux - Illuminating Your Network's Darkest Corners
No, François. This kind of sniffer has nothing to do with wine. Wine is one area when the human nose performs far better than any software, no matter how clever the programmer. Honestly, mon ami, sampling the wine, for quality control reasons of course, is not a task I wish to automate. Other uses exist for the kinds of sniffers we are likely to encounter when cooking with Linux.
Look here, mon ami. Notice how much of our bandwidth is being used here and here. Are you curious as to what those connections really represent? François, why are you looking away? Ah, our guests are here. Why did you not say something?
Bonsoir, mes amis! Welcome once again to Chez Marcel, home of tantalizing Linux fare, great wines from the world over and a general penchant for all things open source. Please sit and make yourselves comfortable. Before you walked in, I was telling François about the many hidden bits of information flying across the average network. Speaking of hidden delights, François, please hurry to the wine cellar. Head to the west wing and bring back the 1995 Rioja Imperial Gran Reserva. This Spanish red is the perfect networking wine, non?
As I was telling my faithful waiter, a great deal is happening on the average network, and many people are completely oblivious to all but those connections they themselves have initiated. The simplest tool for checking out active network connections is included in every Linux distribution, netstat. By using the -a and -p options, you can find out about almost every open connection (or port) on your system and what programs are using them.
Notice what happens when I run the program. I'm going to use the -n option as well, which tells netstat not to worry about resolving IP addresses into symbolic addresses. This makes the program run a bit faster because no name resolution is performed. The result can be quite a long listing, so I pipe the output to more:
Ah François, you are back with the wine. Excellent. Please pour for our guests.
The listing I've shown you is only a partial listing, but the entire listing is incomplete itself. The reason for this is iptables masqueraded connections are not visible to netstat; that information is in another location, specifically /proc/net/ip_conntrack. The PID is the process ID of the running program using the connection. Now, we could do a cat on /proc/net/ip_conntrack, but the output doesn't make for eye-friendly reading. Look at the following sample (the output is a single, wrapped line):
tcp      6 431253 ESTABLISHED src=192.168.22.5
↪dst=192.168.22.10 sport=34212 dport=22
↪src=192.168.22.10 dst=192.168.22.5 sport=22
↪dport=34212 [ASSURED] use=1
Patrick Lagacé obviously found this unpleasant to read as well. His conntrack viewer script is available at cv.intellos.net. Because it is a Perl script, simply change the permissions to make the script executable after you have downloaded it, then run the command:
chmod +x conntrack-viewer.pl
./contrack-viewer.pl
By default, the output shows all connections, including the masqueraded ones. To limit the output to masqueraded connections only, use the -m option. The reverse effect (no masqueraded connections) can be achieved with the -d option. Have a look at Figure 1 for a sample of the output.
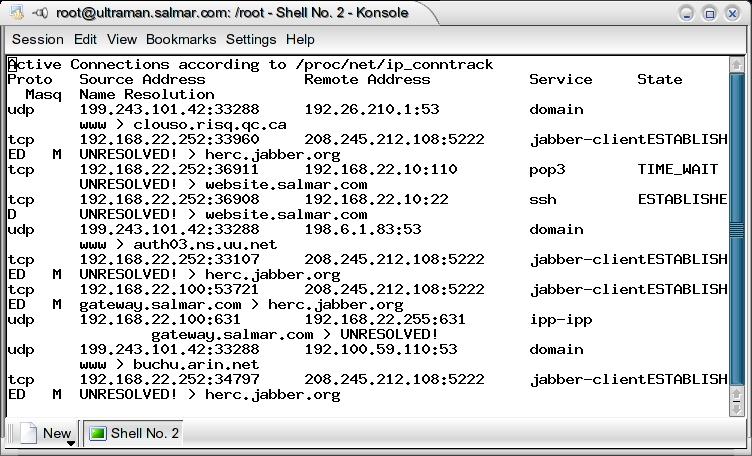
Figure 1. conntrack Viewer Displays Masqueraded Connections
Alexander Neptun's Nnetstat is a nice graphical tool for displaying active connections, routing tables and so on. To get your copy, visit www.aneptun.de/linux/Nnetstat and download the latest version. This is basically a Perl script, so no real installation has to be done other than making sure Nnetstat.pl is executable. As it turns out, Nnetstat also requires the Gtk.pm modules libraries, and while Perl should be on your system, this module likely is not. The easiest way to get it is from the Perl CPAN repository, and the command line still is your friend here:
perl -MCPAN -e "install Gtk"
If this is the first time you install Perl modules in this manner, you'll go through a little question-and-answer session. Follow through, accept the defaults and trust the system. What you need to decide is the location of the closest CPAN mirrors. Select your continent and country when asked, then select the available local mirrors. Once this is done, the Gtk installation continues on its own.
Installing the Gtk Perl modules does take some time. I probably should warn you that at some point near the end of the installation, a set of tests is performed. Don't be surprised when a graphical box pops up asking you to click Run to test all sorts of graphical magic associated with the package. When you are happy with the result, click Close to terminate the tests and complete the installation.
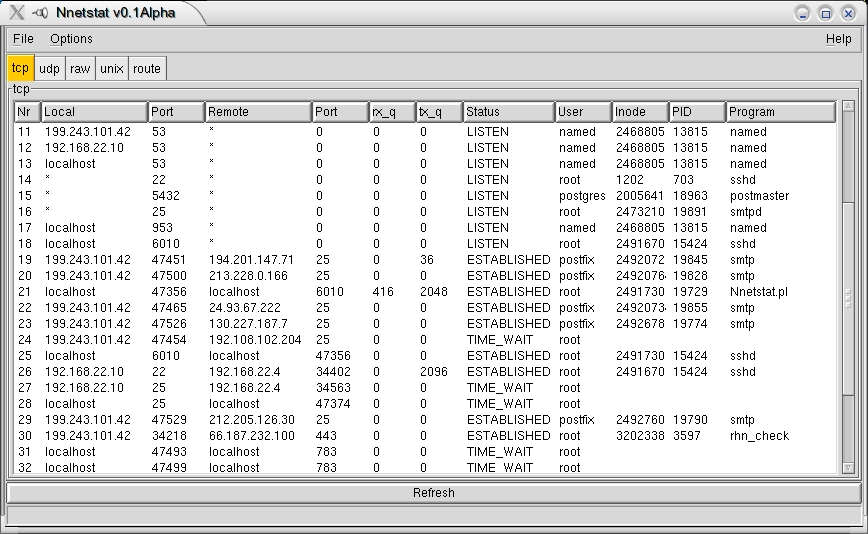
Figure 2. Nnetstat is a nice, graphical netstat.
For a truly terrifying (or amusing, depending on your perspective) view of exactly what is flying across your system, run Driftnet. The name itself should be enough to send shivers up your spine. Simply put, Driftnet listens on a selected interface for image or video traffic (MPEG only), then displays the images it finds. Whether this display is more frightening to the system administrator who finds out what users are watching or to the users themselves, depends on more factors than we adequately can cover here. That said, this collection of images is completely indiscriminate and doesn't in any way point to a specific user.
To get your copy of Driftnet, head on over to Chris Lightfoot's web site at www.ex-parrot.com/~chris/driftnet and pick up the source. Before the Pythonists among you ask, last time I checked, his web site had not yet ceased to be nor was it pining for the Fjords.
Some prerequisite libraries are required to build Driftnet, most notably libungif, libjpeg and libpcap. If you don't have them installed already, the links are in the Resources section of this article, but check your distribution CDs first. Building the package is then a simple matter of extracting the tarball and running a make in the source directory. You then can run the resulting program from the directory itself or copy it to a more useful location:
./driftnet -i eth0
Because Driftnet needs to set the interface to promiscuous mode, you need to run it as root. Look at Figure 3 for a sample of Driftnet in action.
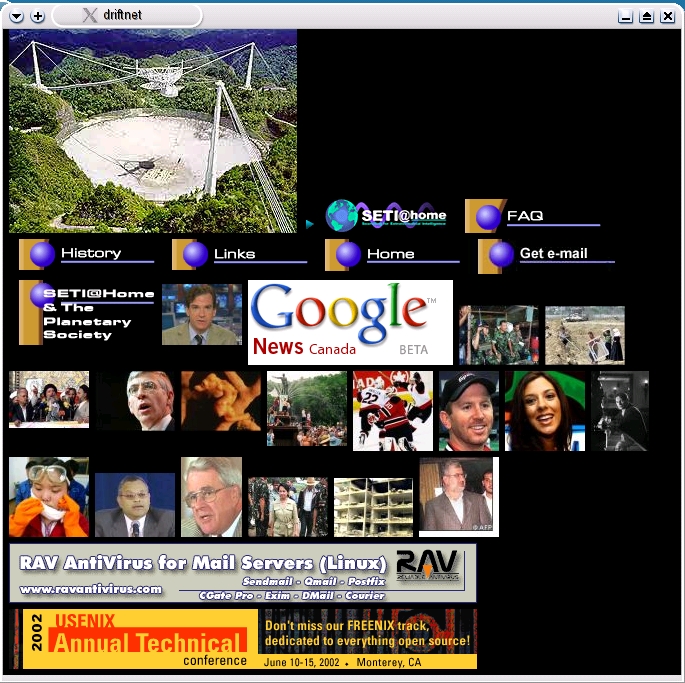
Figure 3. Driftnet in action: all your images belong to us.
Sure, looking at pretty pictures flying across your network is fun if you don't consider the bandwidth costs, but what other interesting things are moving across those wires? There are Web requests, file downloads, e-mail messages, instant messaging sessions and more. Most network monitors, netstat included, show you active connections, but what precisely do those connections represent?
David Leonard has created an ncurses-based program called pktstat (www.itee.uq.edu.au/~leonard/personal/software/#pktstat) that does a nice job of showing you what percentage of bandwidth each connection uses. It also keeps a running load average in the style of uptime but tracks network transfer rates rather than processes in a run queue. What sets the program apart is its ability to display filenames associated with the packets sailing across your Web server or files being downloaded from client PCs on your network. Building pktstat is a matter of extracting the source, switching to the directory and typing make:
tar -xzvf pktstat-1.7.2q.tar.gz
cd pktstat-1.7.2q
make
su -c "make install"
To run the program, use the -i parameter to specify the interface on which you wish to listen:
pktstat -i eth1
A window appears, similar to the one in Figure 4. As you can see, I've started a download of the latest OpenOffice.org software. The actual filename is displayed below the connection information; the same is true with HTTP Web requests. You can see not only the address of the file being downloaded but the filename too, whether it be an HTML page or an image.
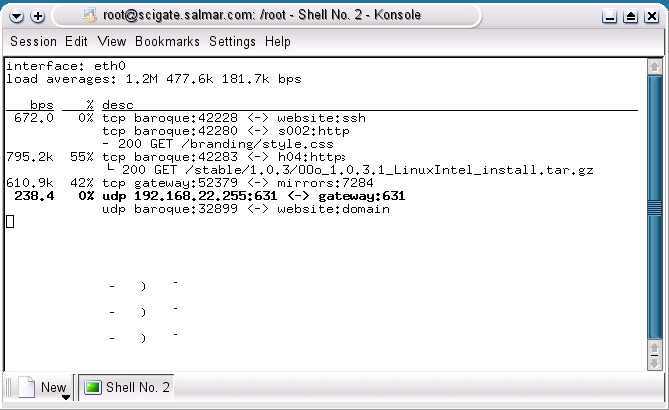
Figure 4. Filenames are resolved in pktstat's display.
Speaking of traffic, if you are looking to concentrate your efforts simply on what and where your network is being used, the final item on tonight's menu may be more appropriate. IPTraf is one of your humble chef's favorite IP-traffic monitoring tools, one that I go back to time and again. This is a ncurses-based application that displays IP traffic, byte and packet counts (including non-IP packets), UDP traffic, incoming vs. outgoing traffic and more. IPTraf is a package every person in charge of a network should have handy.
Visit Gerard Paul Java's web site at iptraf.seul.org to pick up your copy of IPTraf. Extract the tarred and gzipped source, then cd to that directory and run the Setup to build the package. The installation process finishes by copying the binary to /usr/local/bin. To run IPTraf, type iptraf, press Enter and you are on your way (Figure 5 shows an active IPTraf session).
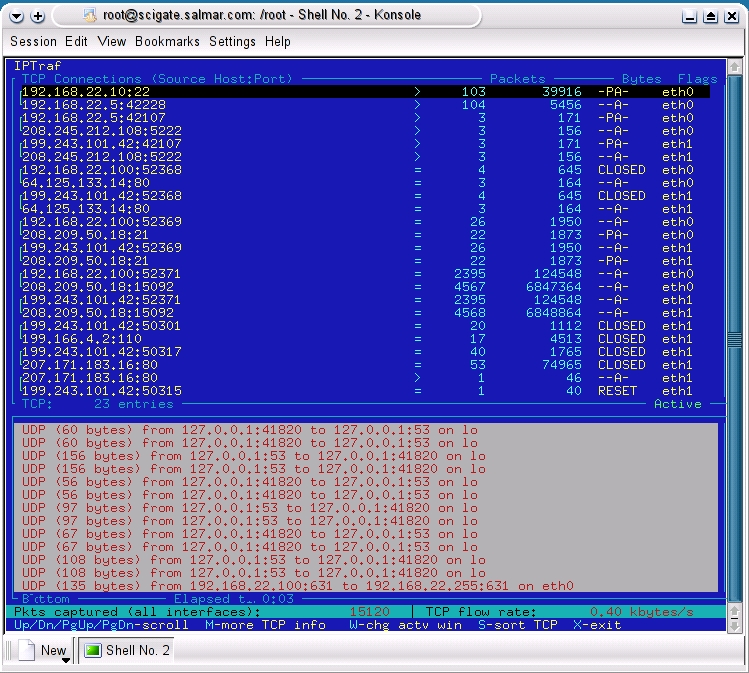
Figure 5. IPTraf's Default Monitoring Window
As IPTraf gathers and displays information, the screen may get very busy, very quickly. What I like to do is run the program in a larger X terminal, say 80 × 40. Pressing the Esc key lets you back out of the current function or view. From there, you can change settings, add or remove filters and continue with your data gathering. IPTraf also provides different views, from the default station-to-station traffic, basic and detailed interface traffic stats and physical stats to packet size breakdowns. Don't be fooled by the apparent simplicity of this package. IPTraf is flexible enough to satisfy a great many IP monitoring needs.
Well, mes amis, closing time is rapidly approaching. As François refills your glasses, I hope you will walk away with an appreciation of exactly how much is happening on your network. Keep in mind, however, that along with the richness of information these tools can deliver, moral and social implications are attached. Good system administrators know what is happening on their networks. They also know when to look the other way. On that note, I raise my glass to you, mes amis. A vôtre santé! Bon appétit!
Resources
Conntrack Viewer: cv.intellos.net
Driftnet: www.ex-parrot.com/~chris/driftnet
IPTraf: iptraf.seul.org
Libjpeg (Independent JPEG Group): www.ijg.org
Libpcap (packet capture library): www.tcpdump.org
Libungif: prtr-13.ucsc.edu/~badger/software/libungif
Nnetstat: www.aneptun.de/linux/Nnetstat
Pktstat: www.itee.uq.edu.au/~leonard/personal/software/#pktstat
Marcel's Wine Page: www.marcelgagne.com/wine.html
Marcel Gagné lives in Mississauga, Ontario. He is the author of Linux System Administration: A User's Guide (ISBN 0-201-71934-7), published by Addison-Wesley, and is currently at work on his next book. He can be reached via e-mail at mggagne@salmar.com.

