
Stack Backtracing Inside Your Program
If you usually work with non-trivial C sources, you may have wondered which execution path (that is, which sequence of function calls) brought you to a certain point in your program. Also, it would be even more useful if you could have that piece of information whenever your beautiful, bug-free program suddenly crashes, and you have no debugger at hand. What is needed is a stack backtrace and, thanks to a little known feature of the GNU C library, obtaining it is a fairly easy task.
Before diving into the article, let's briefly go over how function calls and parameters pass work in C. In order to prepare for the function call, parameters are pushed on the stack in reverse order. Afterwards, the caller's return address also is pushed on the stack and the function is called. Finally, the called function's entry code creates some more space on the stack for storage of automatic variables. This layout commonly is called a stack frame for that particular instance of the function call. When more function calls are nested, the whole procedure is repeated, causing the stack to keep growing downwards and building a chain of stack frames (see Figure 1). Thus, at any given point in a program it theoretically is possible to backtrace the sequence of stack frames to the originating calling point, up to the main() function (to be exact, up to the libc function, which calls main() when the process starts up).
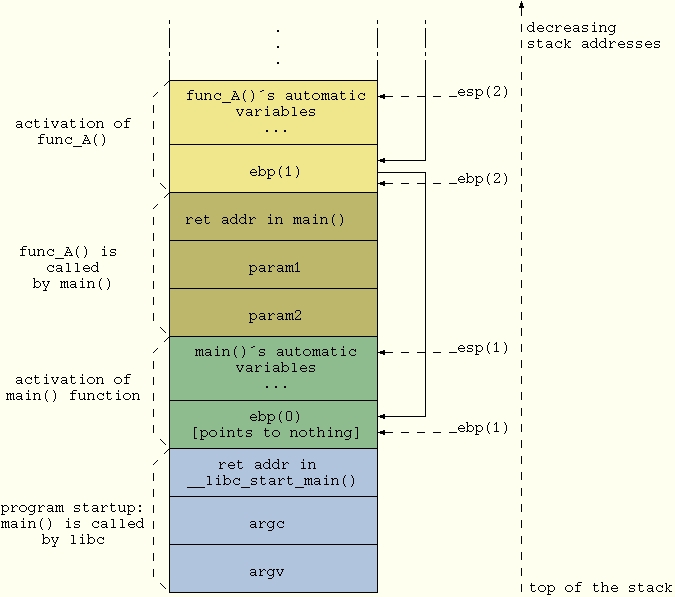
Figure 1. Nested Function Calls
Getting the stack backtrace with GDB (or an equivalent graphical front end) for a program that crashed while running is straightforward: you simply issue the bt command, which returns the list of functions called up to the point of the crash. As this is a standard practice, we do not provide any more details here; have a look at the GDB info page if you need specifics (info gdb stack gets you there).
If for some reason you're not running inside a debugger, two options are available for tracing what the program is doing. The first method is to disseminate it with print and log messages in order to pinpoint the execution path. In a complex program, this option can become cumbersome and tedious even if, with the help of some GCC-specific macros, it can be simplified a bit. Consider, for example, a debug macro such as
#define TRACE_MSG fprintf(stderr, __FUNCTION__     \
                                         "() [%s:%d] here I am\n", \
                         __FILE__, __LINE__)
You can propagate this macro quickly throughout your program by cutting and pasting it. When you do not need it anymore, switch it off simply by defining it to no-op.
A nicer way to get a stack backtrace, however, is to use some of the specific support functions provided by glibc. The key one is backtrace(), which navigates the stack frames from the calling point to the beginning of the program and provides an array of return addresses. You then can map each address to the body of a particular function in your code by having a look at the object file with the nm command. Or, you can do it a simpler way--use backtrace_symbols(). This function transforms a list of return addresses, as returned by backtrace(), into a list of strings, each containing the function name offset within the function and the return address. The list of strings is allocated from your heap space (as if you called malloc()), so you should free() it as soon as you are done with it.
If you prefer to avoid dynamic memory allocation during the backtrace--reasonable, as the backtrace is likely to happen under faulty conditions--you can resort to backtrace_symbols_fd(). This prints the strings directly to the given file descriptor and does not allocate new memory for strings storage. It is a safer choice in those cases where memory heap potentially is corrupted.
In order to convert an address to a function name, the last two functions rely on symbol information to be available inside the program itself. To enable this feature, compile your program with the -rdynamic option (see man dlopen for more details).
Listing 1. How to Use the Backtrace Functions
Listing 1 demonstrates how to use these functions. The test() function calls either func_low() or func_high(), both of which call show_stackframe() to print out the execution path. The program is compiled with
gcc -rdynamic listing1.c -o listing1
The output should look something like:
Execution path:
./listing1(show_stackframe+0x2e) [0x80486de]
./listing1(func_high+0x11) [0x8048799]
./listing1(test+0x43) [0x80487eb]
./listing1(main+0x13) [0x8048817]
/lib/libc.so.6(__libc_start_main+0xbd) [0x4003e17d]
./listing1(backtrace_symbols+0x31) [0x80485f1]
First call: 167
Execution path:
./listing1(show_stackframe+0x2e) [0x80486de]
./listing1(func_low+0x11) [0x8048779]
./listing1(test+0x21) [0x80487c9]
./listing1(main+0x33) [0x8048837]
/lib/libc.so.6(__libc_start_main+0xbd) [0x4003e17d]
./listing1(backtrace_symbols+0x31) [0x80485f1]
Second call: -3
By the way, function prototypes for the backtrace functions reside in the header file execinfo.h.
At this point, we have in hand a tool that is able to print the list of function calls up to the current execution point. This can be a useful tool in many different contexts. Think of having a complex program and needing to know who's calling a given function with the wrong parameters. With a simple check and a call to our show_stackframe() function, the faulty caller can be spotted easily.
An even more useful application for this technique is putting a stack backtrace inside a signal handler and having the latter catch all the "bad" signals your program can receive (SIGSEGV, SIGBUS, SIGILL, SIGFPE and the like). This way, if your program unfortunately crashes and you were not running it with a debugger, you can get a stack trace and know where the fault happened. This technique also can be used to understand where your program is looping in case it stops responding. All you need to do is set up a SIGUSR1/2 handler and send such a signal when needed. Before presenting an example, we need to open a parenthesis on signal handling.
Backtracing from within a signal handler requires some interesting intricacies that take us on a little detour through signal delivery to processes. Going into deep detail on this matter is outside the scope of this article, but we briefly can summarize it this way:
When the kernel needs to notify a signal of a given process, it prepares some data structures attached to the process' task struct and sets a signal-pending bit.
Later on, when the signalee process is scheduled for execution, its stack frame is altered by the kernel in order to have EIP point to the process' signal handler. This way, when the process runs it behaves as if it had called its own signal handler by itself before being suspended.
The initial steps of user space signal management are taken care of inside libc, which eventually calls the real process' signal handling routines which, in turn, execute our stack backtrace function.
As a consequence of this mechanism, the first two entries in the stack frame chain when you get into the signal handler contain, respectively, a return address inside your signal handler and one inside sigaction() in libc. The stack frame of the last function called before the signal (which, in case of fault signals, also is the one that supposedly caused the problem) is lost. Thus, if function B called function A, which in turn caused a SIGSEGV, a plain backtrace would list these entry points:
your_sig_handler()
sigaction() in libc.so
func_B()
main()
and no trace of the call to function A would be found. For more details, have a look at the manuals for signal() and sigaction().
In order to get a meaningful backtrace, we need a workaround. Luckily, when you have the sources of both the kernel and libc, you can find a workaround for nearly anything. In Listing 2 we exploit an undocumented parameter of type sigcontext that is passed to the signal handler (see the UNDOCUMENTED section in man sigaction) and contains, among other things, the value of EIP when the signal was raised. After the call to backtrace(), we use this value to overwrite the useless entry corresponding to the sigaction() return address in the trace array. When we later call backtrace_symbols(), the address we inserted is resolved the same as any other entry in the array. Finally, when we print the backtrace, we start from the second entry (i=1 in the loop), because the first one always would be inside our signal handler.
Since kernel version 2.2 the undocumented parameter to the signal handler has been declared obsolete in adherence with POSIX.1b. A more correct way to retrieve additional information is to use the SA_SIGINFO option when setting the handler, as shown in Listing 3 and documented in the man page. Unfortunately, the siginfo_t structure provided to the handler does not contain the EIP value we need, so we are forced to resort again to an undocumented feature: the third parameter to the signal handler. No man page is going to tell you that such a parameter points to an ucontext_t structure that contains the values of the CPU registers when the signal was raised. From this structure, we are able to extract the value of EIP and proceed as in the previous case.
A couple of points are important to keep in mind when you use the backtrace functions. First, backtrace_symbols() internally calls malloc() and, thus, can fail if the memory heap is corrupted--which might be the case if you are dealing with a fault signal handler. If you need to resolve the return addresses in such a situation, calling backtrace_symbols_fd() is safer, because it directly writes to the given file descriptor without allocating memory. The same reasoning implies that it is safer to use either static or automatic (non dynamic) storage space for the array passed to backtrace().
Also, there are some limitations to the ability of automatically tracing back the execution of a program. The most relevant are some compiler optimizations that, in one way or another, alter the contents of the stack frame or even prevent a function from having one (think of function inlining). Obviously, the stack frame does not even exist for macros, which are not function calls at all. Finally, a stack backtrace is impossible to perform if the stack itself has been corrupted by a memory trash.
Regarding symbol resolution, the current glibc (version 2.3.1 at the time of this writing) allows users to obtain the function name and offset only on systems based on the ELF binary format. Furthermore, static symbols' names cannot be resolved internally, because they cannot be accessed by the dynamic linking facilities. In this case, the external command addr2line can be used instead.
In case you wonder how would you access stack information in a C program, the answer is simple: you can't. Stack handling, in fact, depends heavily on the platform your program runs on, and the C language does not provide any means to do it in a standard way. The implementation of backtrace() in the glibc library contains platform-specific code for each platform, which is based either on GCC internal variables (__builtin_frame_address and __builtin_return_address) or on assembly code.
In the case of the i386 platform (in glibc-x.x.x/sysdeps/i386/backtrace.c), a couple of lines of assembly code are used to access the contents of the ebp and esp CPU registers, which hold the address of the current stack frame and of the stack pointer for any given function:
register void *ebp __asm__ ("ebp");
register void *esp __asm__ ("esp");
Starting from the value of ebp, it is easy to follow the chain of pointers and move up to the initial stack frame. In this way you gather the sequence of return addresses and build the backtrace.
At this point, you still have to resolve the return addresses into function names, an operation dependent on the binary format you are using. In the case of ELF, it is performed by using a dynamic linker internal function (_dl_addr(), see glibc-x.x.x/sysdeps/generic/elf/backtracesyms.c).
Are you working on a complex program that contains a lot of different execution paths that make you cluelessly wander through hundreds of functions, desperately trying to understand which one called which other function? Wander no more and print a backtrace. It's free, fast and easy. While you are at it, do yourself a favour and also use that function inside a fault signal handler--it's guaranteed to help you with those nasty bugs that appear once in a thousand runs.
Gianluca Insolvibile has been a Linux enthusiast since kernel 0.99pl4. He currently deals with networking and digital video research and development.
email: g.insolvibile@cpr.it

