
Linux Maximus, Part 1: Gladiator-like Oracle Performance
"Damn the torpedoes! Full speed ahead." - Admiral David Farragut
As it does for many people today, the Linux movement enthralls me. I'm interested not only because I'm more of a UNIX-based DBA but also because of the amazing speed with which major vendors, such as HP, Compaq, Dell, IBM and Oracle, have embraced this open-source operating system. Last year Linux server sales accounted for approximately 30% of Compaq's, 13.7% of Dell's and 13.5% of IBM's total server sales, according to eWeek. Moreover, IBM spent a billion dollars on Linux development in 2001, after having ported Linux to all their hardware platforms in 2000. Furthermore, Intel's new 64-bit Itanium CPU lists only four supported operating systems: Windows, Linux, AIX and HP-UX. And let's not forget that Oracle released 9i on Linux months ahead of the Windows port. Then again, maybe I just like the underdog--I mean I'm writing this article on my AMD Athlon-based PC.
But no matter how fashionable Linux may be, that popularity does not automatically translate into nor does it guarantee performance. Even though Linux runs on everything from IBM 3/90s to Sun SPARC-based boxes, most people at this point are still probably running Linux on Intel-based server platforms. Now without sounding condescending, let me state that the PC architecture was never really intended to scale to the heights Linux makes possible. Thus we need to make sure that we squeeze every last drop of blood out of the turnip when we deploy an Intel based Linux server--especially for enterprise databases like DB2 and Oracle. Believe it or not, it's quite easy to get upwards of 1000% database improvement through proper Linux tuning and database configuration for Linux.
As with any scientific endeavor, in this article we will attempt to evaluate different tuning techniques by establishing a controlled environment where we can ascertain a baseline, identify all the changeable relevant variables, modify one variable at a time and obtain a reliable measurement of the effects for that one change. Wow, I haven't written techno-babble like this since I was a Physics student at Ohio State. In plain English, we must test one tuning concept at a time in order to accurately measure the observable effects of only that change.
First you need a test environment. I used a Compaq quad CPU server with 512 megabytes memory and eight 7200 RPM ultra-wide SCSI disks. Then I did the exact same tests with a single CPU Athlon system with the same amount of memory, but with a single 7200 RPM ultra100 IDE disk drive. Although the raw numbers and percentages were not identical, the observed improvement pattern was. That is, every test made each system better in the same general direction and similar magnitude.
Linux servers are truly universal in function, utilized easily as web servers, application servers, database servers, routers, firewalls, e-mail servers, file servers, print servers and combinations of the above. But we need to pick one such usage; remember our single variable requirement.
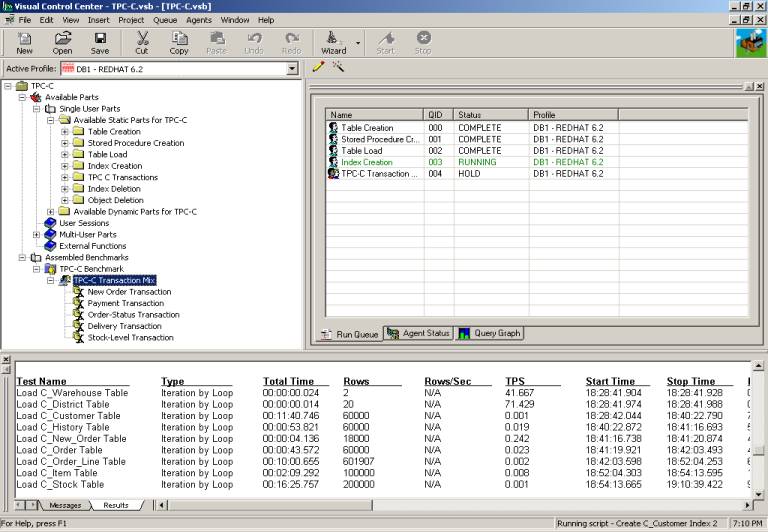
For simplicity, I chose the TPC benchmark as my testing methodology. It's widely recognized as a reliable OLTP workload benchmark, it has both on-line and deferred transactions, it's non-uniform in nature and it applies to numerous databases, including Oracle and DB2. Plus the TPC can be configured to stress all aspects of the hardware: CPU, memory, bus and disk. And to be totally honest, I'm a DBA, and Quest has a wonderful tool called Benchmark Factory that makes defining, running and measuring TPC tests as simple as sending e-mail. The screen snapshot below shows Benchmark Factory's complete interface. With it you can create a TPC benchmark project, define some parameters such as database size and number of concurrent users, copy the tests you want to measure to the run queue, run the tests in the queue and observe the results. No work at all, really.
Figure 1. Benchmark Factory's GUI Interface
Remember, I said that we'd start by looking at some very high ROI approaches. That means we're looking for items so easy and apparent in terms of applicability and impact that we only need observe the runtime differences in the TPC to see if we're on the right track. So we'll be only looking at what I call the OS and DB low-hanging fruits.
NOTE: If you're positive your Oracle database has been created perfectly for Linux, you might choose to skip the database low-hanging fruits section. For many DBAs it might serve as a refresher of some obvious database configuration and tuning issues.
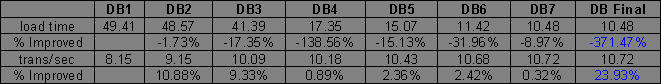
Let's begin by looking at a typical initial database. Often, people start with either the default database created by the Oracle Installer or a database they created using the Database Configuration Assistant. Either way, the default settings are generally quite useless. Plus, a novice DBA or a consultant passing as a DBA might select values that actually make things worse. The point is that databases set up with poor initialization parameters and using dictionary tablespaces as shown in table DB1 are not uncommon.
DB1: Initial Database
Database Block Size | 2K |
SGA Buffer Cache | 64M |
SGA Shared Pool | 64M |
SGA Redo Cache | 4M |
Redo Log Files | 4M |
Tablespaces | Dictionary |
TPC Results (our baseline)
The obvious first choice is to increase the SGA size. So we increase the buffer cache and shared pool as shown in table DB2.
DB2: Cache & Pool
Database Block Size | 2K |
SGA Buffer Cache | 128M |
SGA Shared Pool | 128M |
SGA Redo Cache | 4M |
Redo Log Files | 4M |
Tablespaces | Dictionary |
TPC Results
Not quite what we had hoped for; only a 1.73% improvement in load time and a 10.88% increase in TPS. Okay, so maybe we should have increased the SGA redo log as well. Of course, we don't want the redo log file to be smaller than the SGA memory allocation, so we'll need to bump up the redo log file size to match. This is shown in table DB3.
DB3: Log Buffer
Database Block Size | 2K |
SGA Buffer Cache | 128M |
SGA Shared Pool | 128M |
SGA Redo Cache | 16M |
Redo Log Files | 16M |
Tablespaces | Dictionary |
TPC Results
Now we're getting somewhere. Notice the load time improved by 10, or by 17.35%. And once again the TPS time improved about the same amount, 9.33%. This makes sense because the load and simultaneous inserts, updates and deletes needed much more room than 8M. But it seems like the memory increases are yielding very small improvements. The I/O aspect seems to be where the current problem is. So even though it's an OLTP system, let's try increasing the block size as shown in table DB4.
DB4: 4K Block
Database Block Size | 4K |
SGA Buffer Cache | 128M |
SGA Shared Pool | 128M |
SGA Redo Cache | 16M |
Redo Log Files | 16M |
Tablespaces | Dictionary |
TPC Results
Now we're cooking. Even a PC with its limited bus and I/O capabilities can reap huge benefits from a larger block size. The load time improved over 138%, with no detriment to the TPS. For the moment, let's assume we don't want to try the next block size increase for whatever reason. The next simple idea that comes to mind is to switch from dictionary to locally managed tablespaces, something Oracle has been touting pretty hard. Thus we end up with that shown in table DB5.
DB5: Local Tablespaces
Database Block Size | 4K |
SGA Buffer Cache | 128M |
SGA Shared Pool | 128M |
SGA Redo Cache | 16M |
Redo Log Files | 16M |
Tablespaces | Local |
TPC Results
So Oracle is right, locally managed tablespaces are definitely the way to go. We got over a 15% improvement on the load and about 2% on the TPS. That's okay, but we would really like to see more results like those we saw with the 4K block size. So let's try 8K, as shown in table DB6. It worked before, so maybe it will work again.
DB6: 8K Block
Database Block Size | 8K |
SGA Buffer Cache | 128M |
SGA Shared Pool | 128M |
SGA Redo Cache | 16M |
Redo Log Files | 16M |
Tablespaces | Local |
TPC Results
Not too bad. As before, the larger block size yielded improvements to the load (almost 32%) with no detriment to the TPS. In fact, the TPS improved over 2%. But notice that we have reached a critical juncture in block size increases. The load time improvement decreased quite significantly--138% to 32%--and the TPS gain was nearly three times as much as that of the 4K block size. Further, block size increases will not likely be a good source of no-brainer gains (i.e., so obvious that we don't need to use other performance measuring tools).
So we're rapidly approaching the end of the DB low-hanging fruits. The only other thought that comes to mind is that we have multiple CPUs, maybe we can set up I/O slaves to leverage them. It's worth a try and is shown in table DB7.
DB7: I/O Slaves
Database Block Size | 8K |
SGA Buffer Cache | 128M |
SGA Shared Pool | 128M |
SGA Redo Cache | 16M |
Redo Log Files | 16M |
Tablespaces | Local |
dbwr_io_slaves | 4 |
lgwr_io_slaves (derived) | 4 |
TPC Results
That's another 9% improvement on the load but almost nothing for the TPS. It appears we've gotten all there is from the low-hanging fruits. We got improvements of 342% for the load time and 24% for the TPS; not bad for requiring absolutely no extensive or detailed performance monitoring. The results are summarized below.
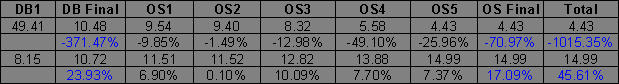
OS Low-Hanging Fruits
So you've just installed Linux. It's smart enough to recognize hardware issues, such as the manufacturer, speed and number of CPUs, the amount of system memory available, and the type, speed and number of disk drives. Nonetheless, many simple, no-brainer opportunities for performance improvement remain to be leveraged. In this case, we'll start on a typical Red Hat 6.2 install. Note that this means that we'll be starting with kernel 2.2.14-5smp, the one that shipped with 6.2.
The first thing anyone should do to Linux after the install is to create a monolithic kernel (i.e., recompile the kernel to statically include libraries you intend to use and to turn off dynamically loaded modules). The idea is that a smaller kernel with just the features you need is superior to a fat kernel supporting things you don't need. Sounds reasonable to me, so we'll cd over to /usr/src/Linux and issue the make clean xconfig command (use make clean config if you boot to the command line instead of X).
There are literally hundreds of parameters to set, and I could recommend any one of a dozen good books or web sites to reference on the subject. Some key ones that stick out in my mind include CPU type, SMP support, APIC support, DMA support, IDE DMA default enabled and quota support. My advice: go through them all and read the xconfig help if you're unsure.
Since we know we're going to recompile the kernel, we might as well fix the IPC (inter process communication) settings, as documented in the Oracle installation guide. For the 2.2 kernel, shared memory settings are located in /usr/src/Linux/include/asm/shmparam.h. I suggest setting the SHMMAX parameter value to at least 0x13000000. The semaphor settings are located in /usr/src/Linux/include/Linux/sem.h. I recommend setting SEMMNI, SEMMSL and SEMOPN to at least 100, 512, 100, respectively.
Now we recompile the kernel by typing make dep clean bzImage. Copy the link map and kernel image to your boot directory, edit /etc/lilo.conf, run lilo and reboot. If you've done everything correctly, the machine will boot using your new, leaner and meaner kernel.
In my case, the monolithic kernel with properly sized IPC settings improved the load by nearly 10% and the TPS by nearly 8%, as shown in table OS1.
OS1: Mono Kernel & IPC
If simply recompiling a specific version of the kernel can yield such improvements, then it stand to reason that a newer version of the same kernel family will also provide improvements. So I obtained the latest stable kernel source within the same family from www.Linux.org (in my case 2.2.16-3smp). But improvements were a paltry 1.5% for the load and practically nothing for the TPS, as shown in table OS2.
OS2: Newer minor version kernel
Since many Linux distributions now use kernel 2.4.x as their base, it made sense to try this next. So I downloaded the kernel source 2.4.1smp, and the new kernel was worth the wait. It yielded improvements of almost 13% on the load and over 10% on the TPS, as shown in table OS3.
OS3: Newer major version kernel
Although these are not bad results so far, in my mind tuning the OS should provide some big hitters, like those we had with the database low-hanging fruits. During our low-hanging fruits for the database discussion, we found that items reducing I/O, such as block size and locally managed tablespaces, made big improvements. So the goal is to find a Linux technique to reduce the I/O. That's when it hit me: there's a dirt simple way to cut the I/O in half. By default, Linux updates the last-time-read attribute of any file during a read operation. It also does this for writes, but that makes sense. We really don't care when Oracle reads its data files, so we can turn that off. This is known as setting the noatime file attribute (a similar setting exists for Windows 2000 and Windows NT).
If you want to do it for only the Oracle data files, the command is chattr +A file_name. If you want to do an entire directory, the command is chattr -R +A directory_name. But the best method would be to edit /etc/fstab, and for each entry, add the noatime keyword to the filesystem parameter list (i.e., the fourth column). This ensures that the entire set of filesystems benefits from this technique and, more importantly, that the settings persist across reboots. The results are amazing, improvements of nearly 50% for loads and 8% for the TPS, as shown in table OS4.
OS4: noatime file attribute
Another area that comes to mind regarding I/O is the Linux virtual memory subsystem. And as is the beauty of Linux, that too is controllable. We simply need to edit the /ect/sysctl.cong file and add an entry to improve filesystem performance, as follows.
vm.bdflush = 100 1200 128 512 15 5000 500 1884 2
Where according to /usr/src/Linux/Documentation/sysctl/vm.txt:
The first parameter 100 %: governs the maximum number of dirty buffers in the buffer cache. Dirty means that the contents of the buffer still have to be written to disk as opposed to a clean buffer, which can just be forgotten about. Setting this to a high value means that Linux can delay disk writes for a long time, but it also means that it will have to do a lot of I/O at once when memory becomes short. A low value will spread out disk I/O more evenly.
The second parameter 1200 ndirty: gives the maximum number of dirty buffers that bdflush can write to the disk in one time. A high value will mean delayed, bursty I/O, while a small value can lead to memory shortage when bdflush isn't woken up often enough.
The third parameter 128 nrefill: the number of buffers that bdflush will add to the list of free buffers when refill_freelist() is called. It is necessary to allocate free buffers beforehand, as the buffers often are of a different size than the memory pages, and some bookkeeping needs to be done beforehand. The higher the number, the more memory will be wasted and the less often refill_freelist() will need to run.
refill_freelist() 512: when this comes across more than nref_dirt dirty buffers, it will wake up bdflush.
age_buffer 50*HZ, age_super parameters 5*HZ: govern the maximum time Linux waits before writing out a dirty buffer to disk. The value is expressed in jiffies (clockticks); the number of jiffies per second is 100. Age_buffer is the maximum age for data blocks, while age_super is for filesystem metadata.
The fifth 15 and the last two parameters 1884 and 2: unused by the system so we don't need to change the default ones.
The performance improvements were 26% for loads and 7% for TPS. That brings our final results to less than 5 seconds to load what took 50 seconds and nearly double the TPS rate. And remember, we never had to monitor anything; these were the no-brainer or low-hanging fruit improvements.
OS5: bdflush settings
The summarized results were as follows:
The second part of this series, "Linux Maximus, Part 2: the RAW Facts on Filesystems", is now available.
email: bscalzo@yahoo.com

