
Debugging Kernel Modules with User Mode Linux
When you write programs in user space, the worst thing that can happen to your program is a core dump. Your program did something very wrong, so the operating system decided to give you all of its memory and state information back to you in the form of a core file. Core files can then be used to debug your program and fix the problem.
When you program in the kernel, there is no operating system to step in and safely stop your code from running and tell you that you have a problem. The Linux kernel is pretty nice to its own code. Sometimes it can survive a panic, if you are doing something wrong that is relatively benign (these panics are typically called oopses). But, there is nothing to stop your code from overwriting or accessing memory locations from anywhere in the kernel's address space. Also, if your module hangs, the kernel hangs (technically, your current kernel thread hangs, but the result is usually the same).
These problems may sound benign to the naïve, but they are serious issues. If the kernel panics, you rarely know exactly what caused the panic. The typical solution is to put printks everywhere and hope that you stumble across the problem before the messages are lost to the reboot. All of this is assuming that you do not corrupt your filesystem. I have lost an entire filesystem before due to a poorly timed panic (and due to the fact that a badly initialized pointer was overwriting some of ext2's internal structures).
The first thing you learn when kernel programming is to keep all your code on NFS. Files remain safe on another machine. But, that does not save you the time of having e2fsck run every time you panic. Plus, you still can lose your filesystem, even if your source code is safe on another machine.
So, with all of these issues, it is not surprising how few have entered the realm of kernel programming. Now, all that can change.
Back in the mainframe days, when timesharing machines were the norm, the idea of a virtual machine was born. A virtual machine is an encapsulated computer completely at your disposal. A program on a virtual machine has no real access to the physical hardware. All hardware access is controlled by the machine or emulator.
VMware (www.vmware.com) has a very powerful virtual machine that allows you to run any x86-based operating system under Windows NT, 2000, XP or Linux. SoftPC (an 8086 emulator allowing you to run Windows and DOS programs) has been available on Motorola 68k-based computers (i.e., the Macintosh) since 1988.
True virtual machines are sometimes too expensive for the learner's budget. (VMware Workstation for Linux costs $299 US from their web site.) Thankfully, there is now a free alternative for those only wanting to run Linux: User-Mode Linux (UML).
User-Mode Linux (user-mode-linux.sourceforge.net) is not a complete virtual machine. It does not emulate different hardware or give you the ability to run other operating systems. But, it does allow you to run a kernel in user space. This gives you several benefits when it comes to development: the host filesystem is safe from corruption, the virtual filesystem is undoable (which makes it safe from corruption), you can run multiple machines on one machine (this is useful for testing intermachine communication, i.e., network messages, without having to use multiple machines) and it is very easy to run the kernel in a debugger.
Running UML is easy. You can download one of the binary packages (kernel binaries, plus a couple of tools), or you can download the kernel patch. You also need to download a filesystem. I'd recommend playing with the binaries first, then building a custom kernel to suit your needs. The HOWTO covers all of these topics and more.
One useful benefit of UML is Copy-on-Write files. These files allow you to modify a virtual filesystem, without modifying the base filesystem. All writes or modifications to a filesystem are stored in these files, typically ending with the extension .cow.
So, when you are working, and you panic the filesystem, all you do is remove the .cow file (which will be recreated), and your corrupted filesystem is restored to its pristine version. (There are also tools to incorporate the changes in a .cow file back into the original filesystem, if you want to keep your changes.)
Once you have UML up and running, it's time to play. I've written a very simple kernel module for testing. It uses four devices, /dev/gentest[0-3]. The module treats each device a little differently. Device 1 is a sink (just like /dev/null). Device 2 stores a string for later retrieval. You can read the status of the module from device 3, and device 0 could be any of the other three devices, depending on how it is configured. (You can change the configuration with ioctl calls.) The kernel module is available from www.frascone.com/kHacking/gentest-0.1.tar.gz.
So, let's make a bug—a nasty one. Let's say when someone opens device 4 (cat /dev/gentest4), the module hangs in a nasty loop: for(;;) i++; (see Listing 1). Deadlocks or hangs are common errors when writing programs. They are sometimes hard to find. Typically programmers just use printks to locate the errors: printk("Got here!\n");. This type of debugging works, but you still hang the system several times before you find the problem. With constant fscks, it can get ugly. But, with UML, you just add in the printks and reboot to a fresh filesystem every time to test it.
UML will help us find that bug with printks, but it is nothing that would have caused us more than a few reboots. Now let's make our first really nasty bug. Let's say that when someone reads from device 5 (i.e., cat /dev/gentest5); the module starts to overwrite all memory: memset(0, 0, 0xffffffff); (see Listing 2). Overwriting memory is a common error in C programs. In the kernel it is especially nasty and can sometimes cause an instant reboot, keeping you from seeing any printks that are generated. These bugs can still be isolated with printk, but it is a very time-consuming process.
From what I've covered so far, UML is a great debugging tool. You can use it to keep your filesystem safe when debugging modules. But there's something more: GDB.
As most experienced kernel programmers know, there is already a way to debug a kernel using GDB and the serial line. But, in my experience, it really doesn't work very well. The GDB shim in the kernel sometimes hangs, and you need two machines to make it work. I have successfully debugged kernels running in VMware on one machine by redirecting the virtual machine's serial port to a file, but it was slow going, since the kernel portion of the GDB code could still sometimes hang.
UML makes all that a thing of the past. With UML, you can run the entire virtual machine under GDB, attach to a kernel while it's running, or even after a panic. The easiest way to run UML under GDB is to add the command-line flag debug to your runline. UML will then spawn GDB in an xterm for you and stop the kernel. For most purposes, just type c to allow the kernel to continue booting up (see Figure 1).
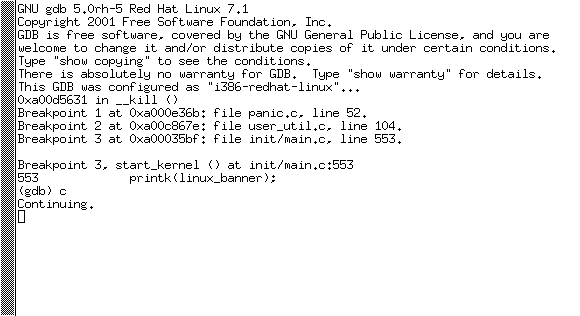
Figure 1. Running UML under GDB
To debug the module, you first have to load the module, then tell GDB where the symbol file is, then set any breakpoints you need.
So, first things first, load the module. Included in the source code is a simple shell script called loadModule that loads the module and creates the devices if they do not already exist.
Once the module is loaded, press Ctrl-C inside the GDB window to pause the kernel, and look at the module_list pointer. The last module loaded should be at the head of the list. You can use a simple printf command to get the address of the module. You'll need it when loading the symbol file (see Figure 2).
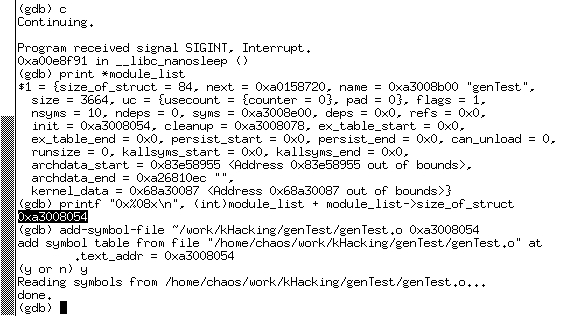
Figure 2. Module List
Now, load the symbols file with the command add-symbol-file MODULE_PATH ADDRESS. The filename used is the filename on the host system, not on the virtual machine. After answering “y” to an “Are you sure you know what you're doing?” question, the symbol file is loaded. You can check that it has been loaded correctly by re-examining the module_list pointer again. Notice that now the init and cleanup pointers have the appropriate function names associated with their addresses (see Figure 3).
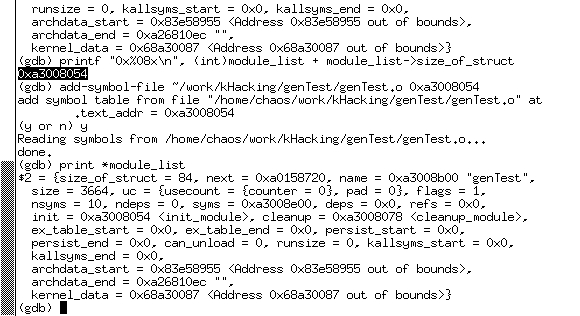
Figure 3. Loading the Symbol File
Now that the module is loaded, you can set any breakpoints you want. I'll set a breakpoint at open and then try to cat one of the devices (see Figure 4).
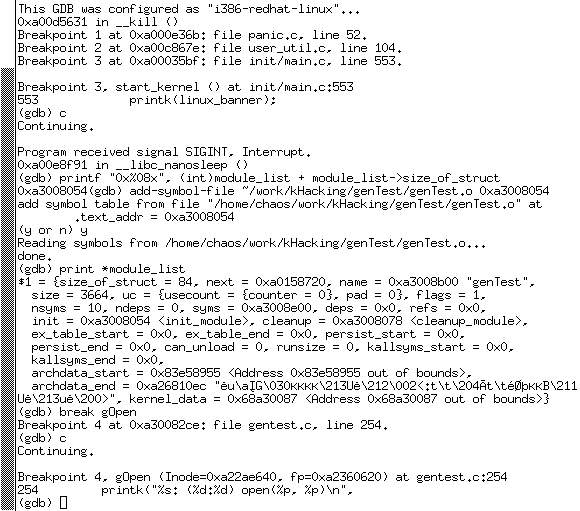
Figure 4. Setting Breakpoints
Now, let's run our two tests and see how hard the bugs are to find when using GDB. On the first test, the system still hangs. But, now we can press Ctrl-C in the debugger and see where it is hung.
In the hang test (see Figure 5) it is obvious that the current stopping point is inside the for loop. If we really want to have fun, we can print out the value of i to see what it contains.
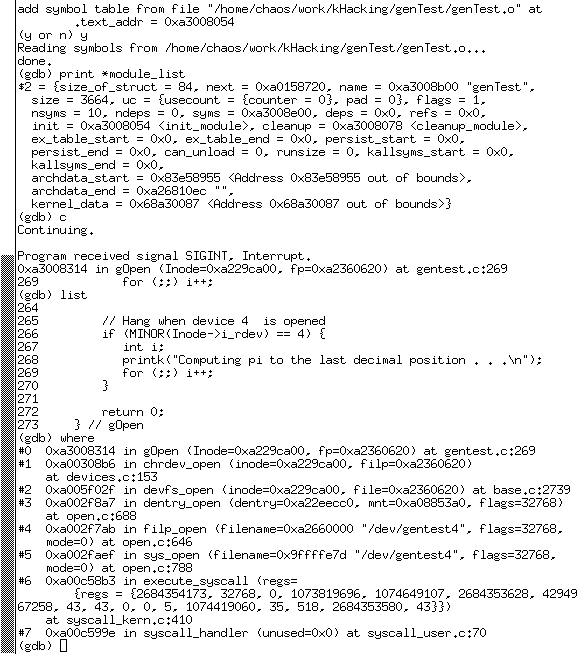
Figure 5. Hang Test
Now, the memory overwrite is a bit more difficult. Not because it is a panic, but because I used memset. memset, in the GNU libc, ends up inserting inline assembly into your code, so it looks like your bug is in string.h, instead of your module. But, it still lets you know which function the error occurred in, and you still know it is inside of a memset (see Figure 6).
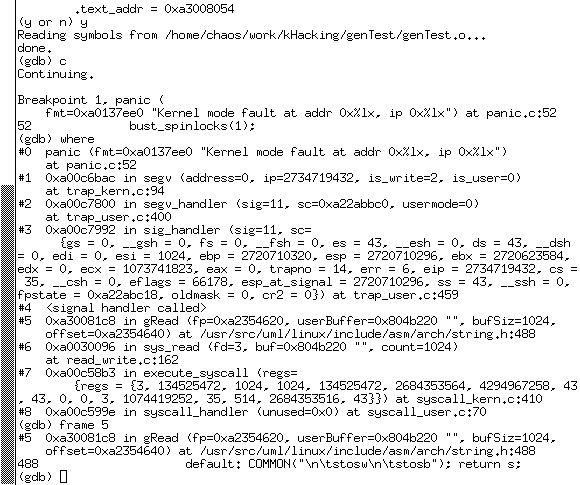
Figure 6. Memory Overwrite
Also, you still can examine any local variables in the current function (gRead) or any global variables to help you find the problem.
While UML might not let you debug a device driver (since UML does not have access to the physical hardware on the machine), it is an invaluable aid in debugging kernel modules. It allows you to write and debug kernel modules as easily as other C programs, without fear of panics, deadlocks and data loss. It is a useful addition to any kernel hacker's toolbelt.


