
Your Network's Secret Life, Part 5
Yes, that's the definition for the tool we'll be covering today according to the American Heritage Dictionary. Actually, there is one other definition, "heavenly". I'll let you think on that for a moment as I welcome you to the latest installment of the SysAdmin's Corner. But first...a little unfinished business regarding the last installment of yon corner.
Before I leave the subject of xinetd and move on, I have to show you one other really cool thing you can do with it. Using the redirect attribute, you can create a service (or specify an existing one) and have all traffic redirected to another port on another machine. One reason for doing this might be to redirect web traffic to a machine other than your internet gateway or firewall (in your internal network). Let's look at an example. I created a service on port 2001 called fakeweb and added it to my /etc/services file.
fakeweb 2001/tcp
Then, I created a new paragraph for that service in my /etc/xinetd.d directory, calling the file fakeweb. Here's what is in that file:
   service fakeweb
   {
        socket_type             = stream
        wait                    = no
        user                    = root
        redirect                = www.linuxjournal.com 80
        disable                 = no
   }
Have a look at the "redirect" attribute. It contains a hostname (or IP address) and a port number. For my rather silly example, I decided I wanted an internal port on 2001 that brings up the Linux Journal web site. In order for all this to take effect, you need to restart xinetd. We'll do a soft reset, just as in the last column.
   # ps as | grep xinetd
   529 ?  S   0:00 xinetd -stayalive -reuse -pidfile /var/run/xinetd.pid
   # kill -USR1 529
Now, when I type http://my_server:2001 in my browser, I am automagically transported to the Linux Journal web site.
Other than my little excursion into xinetd, I've used this series to show you ways in which you can make some sense of the packets flying around your network, and the tools that can help you do that. I started this article by giving you the dictionary definition for "ethereal". Ethereal also happens to be the name of an excellent network protocol analyzer, a powerful tool that lets you see what is happening on your network right now. Ethereal is available for a variety of platforms and is distributed free under the GPL. While it is technically beta software, you'll be amazed at how useful you'll find it.
Ethereal is another of those programs that requires the libpcap packet capture libraries. We've talked about this one before, most recently in the third part of this series. If you don't already have it, check out the libpcap web site at http://www.tcpdump.org. You'll also need GTK+ (likely to be already installed on your system). GTK+ is available from http://www.gtk.org.
Should you decide to save yourself a few steps, a number of precompiled binary distributions exist for Ethereal, including DEBs and RPMs. For the latest and greatest, you can always download the source and build it yourself. Start by paying the Ethereal web site at visit at http://www.ethereal.com. Then extract and build the software.
     tar -xzvf ethereal-0.8.19.tar.gz
     cd ethereal-0.8.19
     ./configure
     make
     make install
Let's start Ethereal in a fairly basic way--we'll pass the -i flag and specify the interface we want to collect packets on. For instance, if your internet gateway used eth1, you would use this command:
ethereal -i eth1
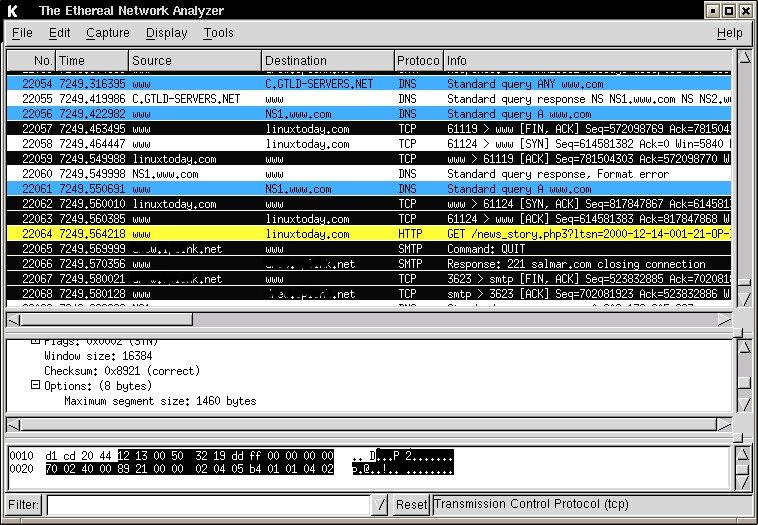
Notice that the window is divided into three panes. The top part of the screen shows each and every packet as they are captured by ethereal. The second pane comes into play when you select one of the packets in the top pane, essentially allowing you to zoom in on that individual packet. Finally, the bottom part of the window shows the raw packet data.
Click Capture and choose Start from the drop-down menu. I also clicked the box to update the list of packets in real time as well as the live scrolling option. Two things happen now. The first is a small capture stats window pops up (with a Stop button at the bottom). It lists a handful of protocols (TCP, ICMP, UDP, NETBIOS, IPX, etc.) and their percentage breakdown in terms of network traffic. Right off the bat, this is a nice snapshot of how your network traffic is divided. The second thing is that our main Ethereal window starts listing packets. For a look at Ethereal in action, click here.
Notice the color bars. I find many things extremely useful when using Ethereal, and this is one of them. You can highlight certain protocols in the display window by colorizing that packet type. As an example, I highlighted all http.request packets in yellow and all DNS requests in blue. TCP acks show up in reverse video with white text on black. To do this, I click on the Display menu and choose Colorize display. This brings up a box like the one below.
Notice that the filters consist of a name and a filter string. The name can be anything that means something to you. The filter string is a bit more specific than that. To find out what these are, click on Help and choose (believe it or not) Help. You'll get a multitabbed help screen from which you select the Display Filters tab. Everything that Ethereal watches for is listed here.
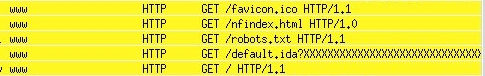
This isn't the only way to make the list of packets a little easier to follow. Have another look at the main Ethereal window. See that Filter button at the bottom left hand corner? You can enter the field you wish to filter right there. Since I wanted to watch web requests coming across the interface, I entered http.request. This results in a display that shows nothing but my http requests, which served to highlight a Code Red worm infiltration attempt. Incidentally, that's the line that runs "GET /default.ida?XXXXXXXXXXXXX".

(I'm glad I was running Linux.) Yes, I trimmed the first part of the display in order to hide the potentially innocent victim whose server was now trying to attack mine.
You can also save your current data for later examination. When you feel that you have captured enough information, click Stop on the little percentage statistics window, then click File (on the main Ethereal window) and choose Save as. Give your file a name and you can load it from the same File menu at a later time. Speaking of file, this is as good a time as any for a little word of warning: that packet capture file can get pretty huge after a while.
Before I wrap this up, I should probably tell you that while the GUI is very cool and lets you point and click your way to network omniscience, you can also use the text-based version of the software. In this example, I am starting Ethereal in text mode on interface eth1.
tethereal -i eth1 -V
The -V option displays the protocol tree; all the fields for all the packets. Since you lack the point and click interface here, it makes sense to capture all this to a file so that you can study the information somewhat more leisurely.
Next time around, I want to start something new (well, a bit new anyway) when next we meet here at the SysAdmin's Corner. Until then, remember to ask yourself . . . if you are not watching your network, who is?
Looking for past articles to this series? Click here for a list.
email: ljeditors@ssc.com

