
Your Network's Secret Life, Part 3
I should point out there is a little problem for the user of EtherApe (which I wrote about in the last column in this series). The scoop is that when used in Ethernet mode, the tool leaves your interface in promiscuous mode.
To deal with this you could do a wrapper script that starts the tool and then executes the following command when it exits:
/sbin/ifconfig eth0 -promisc
This assumes, of course, that you were scanning on eth0, as opposed to eth1. Again, sorry about this, but I did not notice until the article had been posted. Again, my apologies.
Just one other thing before I get into today's stuff. To the person who sent me a feedback message asking for "more Italian wine", I'll pass on your request to my alter ego. You might, of course, suggest a decent Italian wine. Last time I checked, Chef Marcel was pretty open on the idea of wine in general--your suggestion may wine, er, wind up in the pages of Linux Journal.
The last couple of articles in this series should have given you an idea that a fair bit is happening on your network. Now that you're getting a good picture of the kind of traffic flying across your network, the next piece of information you might want to get concerns what that traffic is costing you in terms of performance and, that most precious of resources, bandwidth. To get this type of information, I am going to have you look at a little tool called ntop, written by Luca Deri. By the way, if you have used ntop in the past, it's time to have another look at it. If you never have, it is definitely time.
You may already be quite familiar with a tool in your system called top that we discussed on this very corner back in our Tweaking Tux series. What top does is provide a graphical (ncurses-based) interface to your system's performance, load average, CPU usage and so on. You can fire up top from the command line with top.
ntop, on the other hand is completely different, so my comparison was silly. Actually, they are related in an important way, and a demonstration is the best approach. For starters, you will need to obtain the latest ntop package. You can find it at http://www.ntop.org/ntop.html.
You'll find that ntop, like a number of network tools, uses the popular libpcap packet capture library. If you do not already have it on your system, you can either get it from the link on the ntop web site or go straight to the libpcap web site at http://www.tcpdump.org. To build libpcap, download the latest distribution source and follow these steps:
     tar -xzvf libpcap-0.6.2.tar.gz
     cd libpcap-0.6.2
     ./configure
     make
     make install
Note that you can follow all the build steps as a non-admin user, but you will have to be root to do the make install step. Now that we have libpcap built and installed, it is time to build ntop. Start by extracting the source into a temporary directory. Building the software is similar to the process you used for the libpcap libraries.
     tar -xzvf ntop-beta-2105.tgz
     cd ntop
     ./configure
     make
     make install
The hard work is already done, which leaves us with the fun part--working with ntop. Start by calling the program with no options. Okay, I lied. If you have multiple network interfaces, it might make sense to use the -i parameter to start the program. I am also going to suggest that you start the program as a dæmon with the -d option. Here is the complete command:
ntop -i eth1 -d
This assumes of course that you are using eth1 as the interface for watching traffic. Those of you using a dial-up connection will probably use something like ppp0. So now you get a nice message from ntop that said "Bye bye: I'm becoming a dæmon..." and, just like that, you were back at your command prompt. Well, now what? Type the command intop -i eth1, and you will find yourself at a command prompt that looks like this:
intop@eth1>
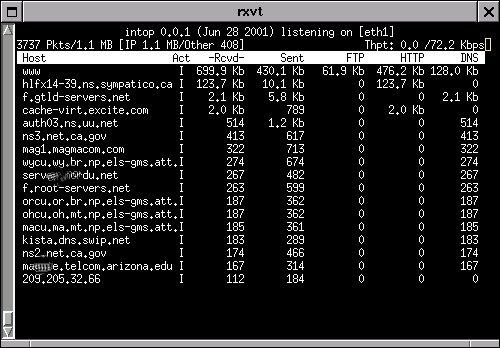
I know what you are thinking--why do you need to specify the interface again? Ah, all will become clear very shortly. You can type a question mark at the prompt, and you will get all sorts of great information on what to do here, but start by typing top. You should get something that looks like the image in Figure 1.
If nothing much is happening, surf over to your favorite web site to generate some traffic and then come back. The numbers you see are dynamic and connections will disappear from the list as time goes on. At any point you can also type h to get some keystroke help. For instance, you can switch from local to remote traffic modes by pressing l. Pressing the letter q gets you out of the interactive display. You can then type quit to get out. Play with this a bit. There are several keystroke commands. In fact, if you press the spacebar, you will cycle between displays of different protocol statistics. Watch the headings on the bar at the top right-hand side of the display.
Need something a little flashier to impress the corporate brass? (Because, as we all know, charts rule in the high, shiny towers of the corporate world.)
Well, to deliver on that flash, I will now tell you why you specified the network interface a second time when I had you run intop after starting ntop. That's because ntop is busy running in the background, collecting information and so forth. Cooler still, is that ntop (the dæmon) can be accessed from your web browser (see Figure 2). Pretend that your web server is called "natika". To call up the ntop browser interface, you would type in the following URL:
http://natika:3000
Port 3000 is where you'll find ntop running. By the way, you can change that default port address with the -w flag. If you had wanted to start ntop on port 3267 instead, you would have typed something like this:
ntop -w 3267 -i eth1 -d
You should have a look at ntop's man page for all the parameters that allow you to modify the modes of operation (I won't cover them all here). The browser's point and click interface is pretty slick, with data displayed in a variety of ways, some tabular, some graphic. Click on the Data Received tab at the top, then click on IP off to the left (the left-hand menus change based on the display mode you choose with the tabs up top). You'll get a nice picture of the hosts or sites you've been in contact with, along with great little icons representing the countries of the representative domains.
Slick. Nice to look at. And useful. With it, you'll start to get an idea as to how much bandwidth is actually being used and how much is going where.
When next we meet here at the SysAdmin's Corner, we'll look at other great ways to visualize and make sense out of all that noise flying about on your network. Until then, remember to ask yourself...if you are not watching your network, who is?
Looking for past articles to this series? Click here for a list.
email: ljeditors@ssc.com

