
Open-Source Software at the Aerodynamics Laboratory
Long ago, before the Open-Source Software (OSS) movement, before the World Wide Web, before the Free Software Foundation and GNU, I was hired by the Unsteady Aerodynamics Laboratory of the National Research Council of Canada to work with the data-acquisition system for their high-speed wind tunnel. At that time, the lab had a specialized real-time minicomputer: a Hewlett-Packard HP-1000 F series. Once a year, through the early- and mid-1980s, I would go to the HP International Users Group conferences and return home with a magnetic tape containing the contributions of the attendees. Mounting that tape and looking through the index file, I felt like a kid unwrapping presents on Christmas morning. This was my first exposure to source code sharing, and I had no idea what the future would hold for such a simple concept.

Canadian National Ski Team Member in the 2m × 3m Tunnel
In 1990 I acquired my first UNIX box, a then state-of-the-art Silicon Graphics 4D/80GT, along with my own T1 connection to the Internet. The switch from a small real-time OS on a standalone computer to an IRIX-based networked machine opened the door to a brave new world with a very steep learning curve. By 1992 I was writing Byzantine scripts that used combinations of shell, awk and sed to manipulate wind tunnel data files. One day when I was on Usenet looking for advice, someone mentioned Perl. I now wish that I had taken notice of whoever it was so that I could thank them for making my life so much easier. Within a year Perl had become indispensable on the SGI as well as on my desktop Macintosh. It would become the most important piece of open-source software at the laboratory.
About that time I experimented with a program that, although it seemed somewhat useful, I underestimated rather badly at first. It was called Mosaic. A short while later, I installed the NCSA's HTTPd and began to understand the potential of the Web. In its later incarnation as Apache, it would become the second largest OSS project upon which the lab depends daily.
The Institute for Aerospace Research was restructured in 1995, and after the dust had settled I found myself at my current location: the 2 × 3 meter, low-speed wind tunnel of the Aerodynamics Laboratory. At that time, I began creating web-based software to extend the capabilities of the existing data system that had relied on command-line and X Window System user interfaces running under QNX and AIX. The decision to switch to browser-based programs was due in large part to the type of clients coming to the tunnel. Even though the bulk of our work is aircraft testing for companies such as Bombardier Aerospace, over the past several years we have tested cars, buses, trucks, motorcycles (my favorite), power lines, bridges, antennae, as well as Olympic cyclists, skiers and bobsled teams. This wide variety of clients, with computer skills that range from inept to adept, makes user-interface design challenging. Since even management knows how to surf the Web, I decided to try a web-based interface written in Perl on one of our applications. The feedback I received was overwhelmingly positive due to the ease-of-use and high comfort level experienced by our clients and staff, so I continued to build web-based tools.

Vehicle Aerodynamics in the 2m x 3m Tunnel
The third significant OSS project to be adopted came several years later. In 1998 we purchased a 24-node Alpha/Linux Beowulf cluster for our computational fluid dynamics group. This was a good project for evaluating new technology because, although this task is much more computationally intensive than the wind tunnel data system, it is not as critical on a daily basis to the lab's clients. The success we experienced with this installation convinced us that Linux was a viable alternative to the commercial operating systems we had been using.
While these big pieces were falling into place, we also began using several smaller OSS applications on a regular basis: Ghostscript, Xmgr, Vim and NEdit, to name just a few.
In order to provide a context for the rest of this article, I'll describe a typical aircraft experiment from the data-processing point of view. After a model is installed in the wind tunnel it usually takes from one to five weeks to complete a test. During that time up to 500,000 independent measurements will be taken. This can result in the creation of as many as 2,000 X-Y plots, 4,000 disk files and as much as 500MB of text data to be displayed on-screen. It is imperative to have fast and simple methods of dealing with all this information.
The clients and test engineers of the laboratory have access to all of the facility's data-acquisition, storage and visualization systems through Perl CGI programs running under Apache (see Figure 1). Much of the control of the experiment by the wind tunnel operators is also handled the same way. When a user opens the web browser on any of the computers in the control room, the wind tunnel client home page is automatically loaded. This page allows access to the five web-based software tools I have written so far: plotting, configuration file editing, data file viewing, event logging and the dynamic data display (see Resources). In addition, there are also links to local resources such as system documentation and a unit-conversion calculator, as well as to off-site information. I'd like to point out that the laboratory uses a rather restrictive intranet model that helps to alleviate some of the security concerns of running web-based systems.
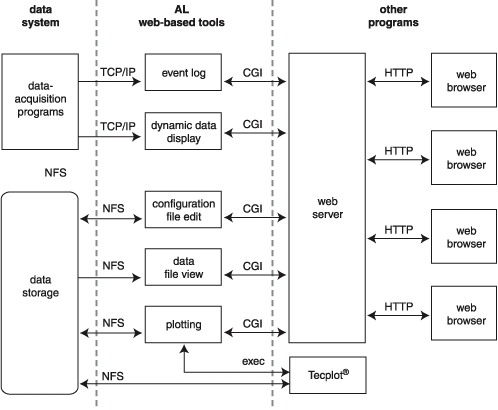
Figure 1. Block Diagram of the Web-Based Software
The plotting system was the first of the software tools to be developed, and as such, was used as a proof-of-concept for the idea of providing clients of the wind tunnel with access to their data through the Web. Since we were already using a commercial data visualization package from Amtek Engineering called Tecplot, I decided to build the plotting system around it. My software allows users to set up plotting templates simply by selecting options and filling in text boxes in an HTML form. These templates are used to generate Tecplot command files that can be utilized immediately to produce plots either on-screen in the browser or on paper. A dæmon program (also written in Perl) also uses those same templates to produce paper plots automatically, at the end of each wind tunnel run.

Spinning F18 Model in the Water Tunnel
Configuration file editing is accomplished through another web-based program. It was created to provide a fast and simple method of modifying the files that control the programs for acquiring and reducing the experimental data. Users are shown a form where each line contains a parameter name with either a text box or a select element to set its value. The Perl program that generates these HTML forms also dynamically generates JavaScript code to validate the user input before it is submitted. If any invalid entries are detected, flashing arrows appear next to the input fields and a popup dialog box describes the specific problems.
The data file viewer is a simple CGI program that searches through the disk space for a given wind tunnel test. It creates an HTML button for each entry found that matches our naming convention for data and configuration files. These buttons are presented to the user in tables where each row corresponds to one tunnel run and each column to a specific data type (e.g., raw, reduced, tare, etc.). Each press of a button brings up a new browser window with the contents of the selected file parsed and formatted for viewing. Then, users have the option of downloading the file to their local computer in CSV, Matlab or one of several other formats.
All of the new software and much of the legacy code generates status messages—events that are handled by an event-logging system that consists of two main parts. The first is a simple Perl dæmon that listens on a TCP/IP port for messages and stores them in log files. The second part of the system is a web-based viewer that allows users to search the log files for events that match specific criteria such as time of occurrence, computer name, event severity level, etc. Although this seems like a trivial application, it is indispensable because the data-acquisition, manipulation and visualization system consists of several computers running heterogeneous operating systems. Finding bugs in this kind of distributed system (especially timing problems due to complex interactions) is difficult if not impossible without a common event log.

Generic Fighter Aircraft Model in the 2m × 3m Tunnel
From the user's perspective, the dynamic data display system is the only noninteractive software tool. It is based on a Perl server that accepts data messages from the data-acquisition systems. Users can view these messages by connecting to the server through a CGI program that uses nonparsed headers (NPH) or “server push”. This program presents the user with a data table and dynamically adds new information to the top of a table as it becomes available. The old data is scrolled down and eventually goes off the end of the table. While creating this code I was somewhat concerned about the possibilities of memory leaks, not only in Perl or Apache, but also in our browsers. I shouldn't have been. We have had individual NPH clients that have remained continuously connected to the server throughout wind tunnel tests that have lasted more than five weeks. During that time they displayed over 500MB of data with no problems.
Individually, each of these five tools works well enough but is hardly revolutionary. When they are combined, however, they form a simple, consistent and robust environment for our clients and staff to interact with their experiment. There is no need to remember obscure commands, long data paths, command key sequences or any of the other things associated with many types of user interfaces. All users need to do is point and click and fill in the blanks on web pages, something they know how to do and with which they are comfortable.
The first thing on my to-do list is to finish moving the Perl code I've developed off our last remaining SGI and onto a dual-processor Intel/Linux system. Although getting the programs running in their current form is a trivial task, I'm using the opportunity to refactor all of the code. There is also one software tool that is partially developed and needs to be finished: the user interface to the model attitude control system. In addition, we are considering changing our data file format from an arcane system developed in-house to one using XML. This will certainly result in the need for more new code.
Peering further into the future, I hope to have the time to develop some VRML applications that create dynamic 3-D graphic simulations of the models and probes in our wind tunnels, with superimposed load and pressure data. Also, our instrumentation group is investigating using embedded/real-time Linux for some of our data-acquisition needs.
With all of this work still to be done, I have no doubt that open-source software will continue to play an increasingly important role in the day-to-day operation of the Aerodynamics Laboratory.


