
Debugging Memory on Linux
All programs use memory, even ones that do nothing. Memory misuse results in a good portion of fatal program errors, such as program termination and unexpected behavior.
Memory is a device for handling information. Program memory is usually associated with the amount of physical memory a computer has but can also reside on secondary storage, such as disk drives, when not in use. Memory for users is managed by two devices: the kernel itself and the actual program using calls to memory functions such as malloc().
The operating system kernel manages all the memory requirements for a particular program, or instances of a program (because operating systems can execute several instances of a program simultaneously). When a user executes a program, the kernel allocates an area of memory for the program. This program then manages the area of memory by splitting it into several areas:
Text—where only the read-only parts of the program are stored. This is usually the actual instruction code of the program. Several instances of the same program can share this area of memory.
Static Data—the area where preknown memory is allocated. This is generally for global variables and static C++ class members. The operating system allocates a copy of this memory area for each instance of the program.
Memory Arena (also known as break space)--the area where dynamic runtime memory is stored. The memory arena consists of the heap and unused memory. The heap is where all user-allocated memory is located. The heap grows up from a lower memory address to a higher memory address.
Stack—whenever a program makes a function call, the current function's state needs to be saved onto the stack. The stack grows down from a higher memory address to a lower memory address. A unique memory arena and stack exists for each instance of the program.

Figure 1. Memory Associated with an Instance of a Program
User-allocatable memory is located in the heap in the memory arena. The memory arena is managed by the routines malloc(), realloc(), free() and calloc(). They are part of libc. However, it is possible to substitute these functions with another implementation that may provide better performance for a particular use. See sidebar for a list of alternate memory functions.
On Linux systems, programs expand the size of the memory arena in precalculated increments, usually one memory page in size or aligned with a boundary. Once the heap requires more than what is available in the memory arena, the memory routines call the brk() system call that requests additional memory from the kernel. The actual increment size can be set by the sbrk() call.
To view the current stack and memory arena of any process, look at the contents of /proc/<pid>/maps for a particular process, where pid is the process id (see Listing 1).
Each time new memory is allocated with malloc(), a little more memory is obtained than requested. The memory routines use this extra memory for maintenance. To obtain the real amount of memory allocated for user manipulation, use the function call malloc_usable_space(). The real memory chunk is usually eight bytes larger.
The structure of a memory chunk has the size of the chunk prepended and added to the end of the chunk (see Figure 2). The size value also has a bit flag that indicates whether the memory management system maintains the memory chunk immediately before the current one.

Figure 2. The Memory Chunk Structure
The memory routines in GNU libc use bins to store memory chunks of similar size to assist in improving performance and preventing fragmented memory areas, where you have unused memory gaps throughout the memory arena. These memory routines are also threadsafe. Though these routines are quick and stable, there may be areas of possible improvement, such as speed and memory coverage.
Memory can cause bugs and usually unwanted memory behavior. One way is by the usage of freed memory, which is the usage of a memory chunk that the program has already freed. Although this will not necessarily cause problems immediately, something will go wrong once a new memory allocation takes over that same area of memory. As a result, the same memory area is used for two different purposes, which causes unexpected values that may lead to a program core dump if the memory area contains pointer values or offsets.
Another problem is trampling over the preamble to a memory chunk. If the program overwrites the preamble to a memory chunk, the memory management system will possibly fail or act unexpectedly when encountering the corrupted memory chunk.
Sometimes trampling occurs over an adjacent memory chunk, and this might corrupt data. The user might only pick up this kind of error later during program execution with odd values and program behavior.
Similarly, if the management information of a freed memory chunk is wrecked by trampling or unwarranted use, it is highly likely that the memory management system will cause an error.
Usage of the unallocated space in the memory arena could also have an effect. It may be possible to use the memory outside of the heap, which is still within the memory arena. This generally will not cause errors until newly allocated memory uses some of this space. This error could be very difficult to detect because the subsequent memory actions could keep within the heap space.
The most obvious and immediate error is when a program attempts to use memory outside of the memory arena and the program memory scope. This results in a SIGSEGV (segmentation violation fault), and the program will automatically dump core.
The most damaging and trickiest-to-debug memory error is when the stack of the program is corrupted. The program stores local variables, parameters and registers from previous frames and, most importantly, the return address in the stack. So if the stack becomes corrupted, the program may become impossible to debug with a conventional debugger, as the stack frames themselves are rendered useless. Debugging stack memory problems is limited to a few open-source (e.g., libsafe) and proprietary memory debuggers because program execution needs to be altered or enhanced to detect stack memory violations.
There are several ways of attempting to catch and find memory misuses. Unfortunately, some have side effects, such as slower program execution speed and more memory usage, and consequently, they may be unusable in memory-intensive programs.
The buggy program examples used with the following memory debuggers can be seen in Listings 2, 3 and 4.
Listing 2. mytest00.c Example Program
Listing 3. mytest01.c Example Program
Listing 4. mytest02.c Example Program
By default there is an environment variable, MALLOC_CHECK_, that can be set to enable rudimentary debugging with the default malloc. MALLOC_CHECK_ can be set to one, in order to provide some error reporting, or set to two to abort the program whenever any malloc error occurs. The output can be cryptic because the debug mode reports problem areas as addresses rather than readable symbols. As a result, it is a good idea to have a debugger on hand to determine where in the program these errors are occurring. The following is an example using default memory debugging:
<home>$ MALLOC_CHECK_=1 ./mytest00
malloc: using debugging hooks
hello Linux users
free(): invalid pointer 0x80496d0
hello again
free(): invalid pointer 0x80496d0
realloc(): invalid pointer 0x80496d0
malloc: top chunk is corrupt
hello there
The output indicates the problem in mytest00.c, line 8 (Listing 2), where the strcpy() function overflows and corrupts the memory chunk pointed to by msg. The subsequent debugging messages are because of this corruption.
There are several excellent open-source memory tools available (see sidebar for a list). Each implementation differs in memory bug coverage, output and interaction.
Electric Fence is one tool that is simple to use. The library performs several memory checks and when encountering an error, stops the program. This usually results in a core dump, which the user then can investigate with a debugger. Electric Fence is most useful when employed within a debugger, such as the GNU debugger (GDB). When Electric Fence stops the program, GDB regains control at the exact location in the program where the error occurred (see Listing 5).
Listing 5. Memory Debugging with Electric Fence within GDB
This example output shows the test built with the Electric Fence library executing under GDB. The very first violation at mytest00.c line 8 results in a SIGSEGV. When examining the stack trace provided by GDB, the user can identify the problem location.
libsafe is used to check a number of possible stack frame boundary violations limited to a few C functions (strcpy, strcat, getwd, gets, scanf, vscanf, fscanf, realpath, sprintf and vsprintf).
The libsafe example output is terse. As soon as a stack error occurs, libsafe displays an error and terminates the program. However, libsafe sends the details of the actual error to various e-mail recipients. Granted, this is a convoluted way of reporting the error, but users primarily use libsafe to detect attempted security breaches that exploit buffer overflow. With a bit of editing, a developer can enhance the libsafe code to report messages that are more informative. Another option is to execute the program in GDB and set a breakpoint on _libsafe_die(), which is hit as soon as a stack violation is detected by libsafe. In the following example libsafe detects stack trampling caused by strcpy() in line 8 of mytest01.c (Listing 3):
<home>$ LD_PRELOAD=/lib/libsafe.so.1.3  ./mytest01
Detected an attempt to write across stack boundary.
Terminating mytest01.
Null message body; hope that's ok
# Email is the sent with the following subject header
libsafe violation for /tmp/mytest01, pid=27265;
overflow caused by strcpy()
debauch limits its output to contain addresses instead of symbols, which makes it necessary to be used with a debugger. debauch has special capabilities that users can activate specifically for GDB use. These capabilities allow better tracking of memory allocation and deallocation calls. debauch is thorough and detects and recovers from many of the memory errors (see Listing 6).
Listing 6. Memory Debugging with debauch
memprof's main feature is the GUI interface, which makes it easy to understand and to see where memory leaks occur. It has fairly powerful capabilities due to the fact that it utilizes functions that GDB uses to control processes via the binary file descriptor (BFD) library. Figure 3 shows that memprof has detected the leak in the function alloc_two() in mytest02.c.
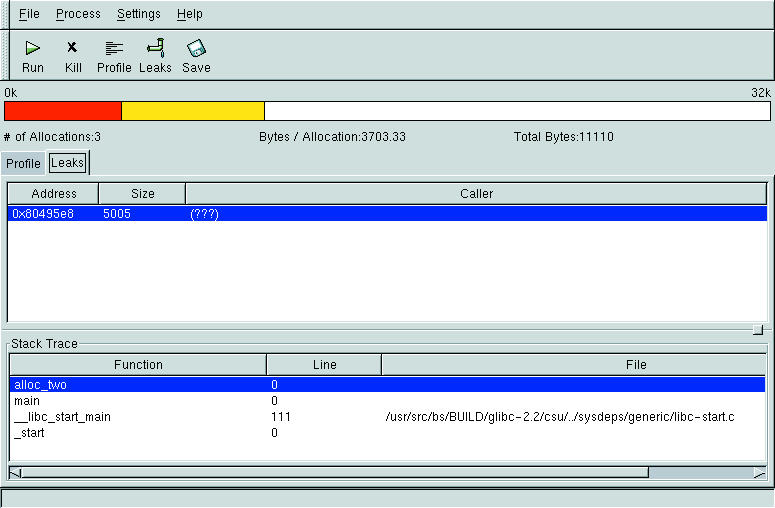
Figure 3. Memory Debugging with memprof
Apart from open-source memory tools, several proprietary tools are available that provide graphical user interfaces and more thorough checks than open-source versions (see sidebar for a list of proprietary memory tools).
Possibly, the last option is to write your own memory handling functions. This might be useful in becoming familiar with memory management or providing performance enhancement due to your particular needs, such a quick allocation and deallocation of large memory areas.
Debugging memory problems is important, for not only program stability, but security as well. There are several memory debuggers available for Linux, each with their own particular set of capabilities and usage criteria. The best approach is to test a program with more than one of these memory debuggers with a debugger such as GDB, as the combined power may detect a wider range of memory problems.


