
Tracing Real-Time Application Interface Using the Linux Trace Toolkit
In the embedded/real-time arena, where operating system licensing costs are high and so are the stakes, the usage of an open-source operating system such as Linux has many advantages. Apart from the cost incentive, it liberates developers from the OS and tool vendors. This, by itself, is often sufficient for developers to make the switch. However, Linux itself does not provide any hard real-time capabilities. Many solutions have been devised whereby the Linux scheduler is replaced by another scheduler more fit for real-time. Again, this still does not make Linux a hard real-time platform, as interrupt latency is not addressed by these solutions.
In order to obtain hard real-time behavior from Linux, it is necessary to use a microkernel layer inserted between the hardware and Linux's interrupt management routines. Two projects are based on this idea: RTLinux, developed by FSMLabs [see ELJ January/February 2001], and RTAI, developed at the Dipartimento di Ingegneria Aerospaziale at the Politecnico di Milano. By themselves, these efforts cannot answer the needs of the embedded/real-time field. In order for Linux to be considered a true and serious contender in the embedded/real-time arena, other tools are needed that, together, form a complete solution. From development tools to debugging utilities, many capabilities are needed.
One such necessary capability is the ability to trace an embedded/real-time system's behavior in order to get a better understanding of its dynamic behavior. This, in turn, helps solve complex synchronization problems and isolate performance bottlenecks. This is precisely what the Linux Trace Toolkit (LTT) provides for RTAI. Apart from providing insight into the behavior of RTAI and the real-time tasks it schedules, it provides a unique perspective in understanding how the Linux kernel interacts with the RTAI subsystem and vice versa.
Building on its capability to trace the Linux kernel [see ``System Administration: The Linux Trace Toolkit'' in the May 2000 issue of our sister publication, Linux Journal], LTT provides a framework for RTAI event tracing. Along with this framework, it predefines a set of key events to be monitored in order to understand RTAI's behavior. To do so, trace statements are inserted along the execution path of key system services. Each of these trace statements logs a different type of event and provides important data about the event's details. For instance, when an interrupt occurs, the trace statement will log the IRQ number and the address space where the interrupt occurred as the event's description.
As with Linux events, RTAI event descriptions are placed into a data buffer that is managed by a device driver. The device driver itself is managed using a dæmon activated by the user with the adequate parameters to control tracing. This same dæmon is responsible for reading the data buffers of the device driver and committing their content to file. Once the tracing process is complete, a visualization tool is provided in order to view the traces and present an analysis of their content.
As with Linux, the RTAI source code has to be patched in order to insert the appropriate trace statements and the trace facility. To that end, a pair of patches is provided for each RTAI release along with the LTT package. Everything can be found on the project's web site at http://www.opersys.com/LTT/.
Along with the usual steps of installing a new kernel and patching it over with the required RTAI patch that provides the necessary hooks to be able to hook onto interrupt management, two more steps are necessary to ready an RTAI system for tracing. The first step is to apply the patch-ltt-rtai-version-yymmdd to the RTAI source using the patch tool. The second step is to apply the patch-ltt-linux-linuxversion-with-rtai-rtaiversion-yymmdd to the RTAI-patched sources of the kernel that is to be traced.
Thereafter, the normal procedure of configuring and building the kernel and RTAI have to be followed. During the kernel configuration process, kernel tracing has to be enabled as a module in order to provide the capability to choose whether RTAI tracing is to be enabled. If the kernel tracing is set to ``yes'', then RTAI tracing cannot be made available. The reason for this is that some symbols needed by the trace driver will be provided by an RTAI module, which by definition cannot be part of the kernel build. At system initialization, the developer will have to load the RTAI tracing framework prior to loading the trace driver and any RTAI modules. This framework functions as the link between the trace statements inserted in RTAI and the trace driver.
Having built the RTAI-modified Linux kernel and RTAI subsystem and having rebooted the system, it is now time to load the required modules. The first module to be loaded is the RTAI tracing framework. If all has been compiled adequately, it should be found under [rtai-base]/modules/rtai_trace. Simply use insmod to load this module. This command should print out this message: RTAI-TRACE: Initialization complete.
The next module to be loaded is the trace driver. If the make modules and make modules_install are issued during the kernel build, then you should only need to type insmod tracer. This will print out the following: Tracer: Initialization complete.
The system is now ready to be traced. However, if tracing is activated now, there will be no RTAI-related information collected, as the RTAI subsystem has not been loaded. In order to load the RTAI subsystem and related modules, move into the RTAI directory and use the ldmod script. This will load the RTAI core module, the FIFO communication capability and the RTAI scheduler. Thereafter, if an RTAI task is loaded and the system is traced, we will be able to trace all the RTAI events that occur.
As with the ``vanilla'' Linux kernel, tracing is started and controlled by the trace dæmon. Typically, when tracing an RTAI task, the steps to follow are:
Load the the trace facility.
Load the trace driver.
Load the RTAI subsystem.
Start the trace dæmon with an adequate time duration for the real-time task to be observed.
Load the real-time task.
Once tracing is over, it is recommended that the real-time task be unloaded as it will remain a priority to any normal Linux process, including the shell. Also, if you plan to visualize the trace right after having accumulated it, which is often the case, then leaving the real-time task active will slow down the visualization tool. This is not desired as the traces tend to be large and the processing required to deal with them can be substantial.
Having seen the necessary background of RTAI tracing, it is now time to proceed with a couple of examples in order to illustrate the full potential of tracing RTAI with LTT. In order to ease the demonstration, the examples distributed with the RTAI source will be used to present RTAI tracing as they are readily available. These examples can be found in [rtai-base]/examples. The examples used are: frank, fp and msg_clock. The purpose of each example is presented, and a set of collected traces regarding the example is discussed.
The frank example consists of a hard real-time module that embodies two real-time tasks and a regular non-real-time application. The real-time tasks communicate with the non-real-time application using FIFOs. These are accessible in normal user space through the /dev/rtfX files, where X is the FIFO's ID. For the real-time tasks, the FIFOs are accessible through the FIFO module's API. By using FIFOs, the real-time tasks can collect data in real time. Meanwhile, the application can read the data through the FIFOs when the normal Linux scheduler gives it the chance to do so. There are many situations where the FIFO mechanism can be useful because of this capability.
Figure 1 illustrates a first example of real-time behavior under Linux using the frank example. As with normal Linux traces displayed by LTT, horizontal lines represent time spent in a certain state while vertical lines signify state transitions. Time is the X axis, while the different tasks and applications (the ``states'') are on the Y axis.
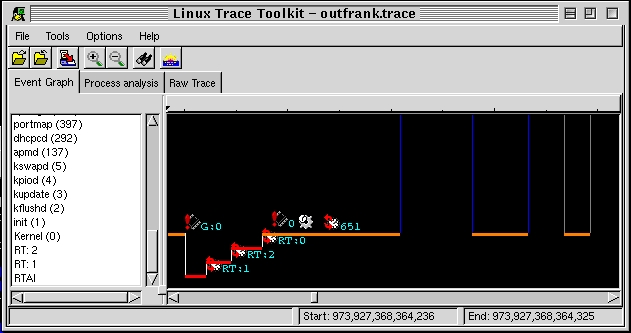
Figure 1. Frank Example Showing Real-Time Task Interactions with Linux Tasks
The portion of trace illustrated in Figure 1 shows the interaction between the two real-time tasks and the non-real-time application. On the left, we can see that an IRQ 0 occurred to signal a timer-expiration. This triggered a transition into the RTAI subsystem (remember that RTAI intercepts all interrupts).
Having received the interrupt, RTAI decides to schedule real-time task one. The task writes something to the FIFO and gives up the CPU. RTAI then determines that real-time task two has to run and schedules it. Real-time task two runs, writes something to the FIFO and gives up the CPU. Having no more real-time tasks to schedule, RTAI schedules the Linux kernel. The latter determines that process 651 has to run. Process 651 is actually the non-real-time process that interacts with real-time tasks one and two, and it was awakened because the files it was waiting on, /dev/rtfX, now contain data. Figure 2 illustrates this interaction using the ``Raw Trace'' thumbnail that lists all the events that occurred in full detail. Correlating this raw list of events with the original source code of the frank example is fairly straightforward.
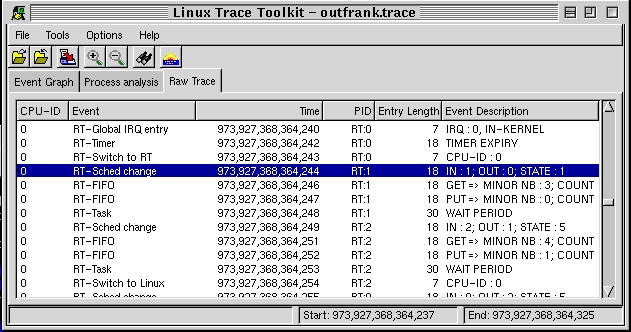
Figure 2. Same Iteraction in Raw Form
The fp (floating point) example's main purpose is to demonstrate that the real-time layer manages the floating-point hardware adequately. That said, it is also very useful in showing how LTT can be used for profiling real-time tasks.
As with the frank example, the fp example is split in half with a hard-real-time part and a non-real-time part. Communication between both halves is conducted using the FIFO's facility as described above. Having traced the execution of the fp example for a certain amount of time, the LTT visualization was able to provide a certain number of details about the example's execution, as seen in Figure 3. In the ``Process analysis'' thumbnail we are able to find that the fp real-time task has run for 9% of the duration of the trace; its average time running on each run is 10.5 microseconds; it typically sleeps for 90 microseconds between runs, and it was scheduled 86,201 times. Moreover, we have information regarding the quantity of data it wrote and read from FIFOs. As the fp example is made to compute a sine, which is then displayed by the non-real-time application, there is much more information written into FIFOs than there is read, as the numbers show.
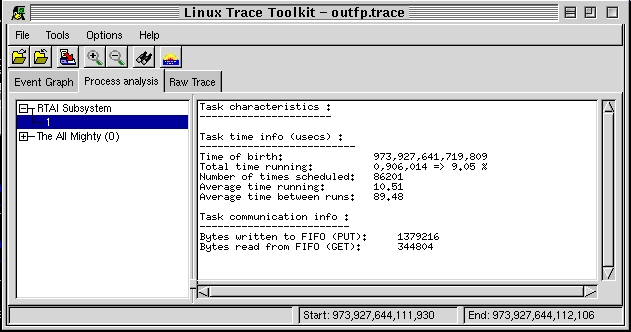
Figure 3. Execution Statistics Regarding the Real-Time Floating-Point Example
The msg_clock example shows an extensive use of communication between different real-time tasks. A portion of these interactions can be seen in Figure 4. Contrary to the previous two examples, the complexity of the interaction would probably require an extensive degree of analysis in order to fully understand the system's evolution. Nonetheless, it is remarkable to have such capability, as it would be impossible to retrieve comparable information with a normal debugger. Furthermore, contrary to a normal debugger, LTT does not modify the normal behavior of the observed process of a task. Hence, complex synchronization problems can be isolated and fixed. Had there been a synchronization problem in the interactions displayed in Figure 4, LTT would have been very helpful in finding it. Note that a tool similar to LTT was used by the team that developed the Mars Pathfinder at the JPL in order to understand why the system kept resetting and, thereafter, apply a fix.
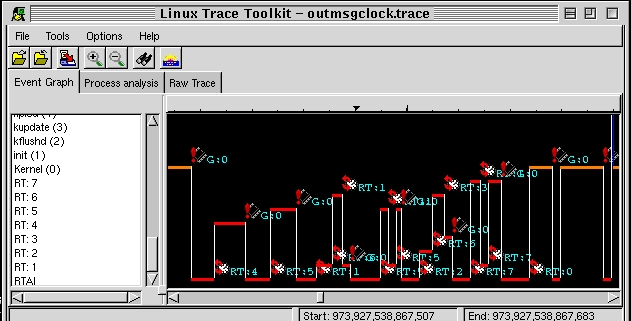
Figure 4. Complex Real-Time Task Interaction as Can Be Seen in the msg_clock Example
LTT has been successfully used by many to understand the behavior of Linux and its real-time derivatives. At the time of this writing, LTT runs on both the i386 and the PowerPC platforms. In the future, other platforms will be supported and remote-tracing will be implemented. Also of interest to some would be the addition of support for operating systems such as Hurd and BSD. The ultimate purpose is to make LTT as pervasive as gdb, gprof and other such development tools.
Karim Yaghmour (karym@opersys.com) is an operating-system freak. He's been playing around with OS internals for quite a while and has even written his own OS. He is the founder of Opersys, Inc. (http://www.opersys.com/), which specializes in providing expertise and courses about the Linux kernel and its real-time derivatives.
email: karym@opersys.com

