
Mapping Lightning with Linux
The New Mexico Institute of Mining and Technology (NM Tech) has developed a deployable system for mapping the lightning discharge activity of thunderstorms in three spatial dimensions and time. The array, which utilizes Global Positioning System (GPS) technology for accurate timing and is patterned after the Lightning Detection and Ranging system developed and utilized by NASA's Kennedy Space Center, is known as the Lightning Mapping Array (LMA) and consists of 10 to 15 stations deployed about a county-wide area of approximately 30-50km in diameter.
Each station detects and accurately times the arrival of impulsive VHF (very high frequency) events in a 6MHz passband centered at 63MHz. The time and magnitude of the impulsive radiation is recorded up to once every 100 µs, making it possible to store up to a maximum of 10,000 triggers per second. Triggers from each station are combined with data from the other stations at a central site, where differential time-of-arrival techniques are used to generate solutions for the locations of the source events, in both space and time. A typical lightning discharge may consist of several hundred to a few thousand located sources. The observations made by the system are found to reflect the basic charge structure of electrified storms, as well as provide invaluable information on the overall storm morphology.
Figure 1 demonstrates observations of a horizontally extensive lightning discharge from a storm over central Oklahoma on the evening of June 10, 1998. The discharge occurred over the southern edge of the measurement network and had an overall extent of 75km. The flash began as an intracloud discharge between the main negative and upper positive charge layers of the storm. Subsequent breakdown in the negative charge level continued the discharge to the north, where it produced a negative-polarity stroke to ground. This discharge, which lasted approximately 2.5 seconds, produced more than 2400 located radiation events and demonstrates the LMA's ability to determine discharge structure at the individual flash level. The different panels show plan view, east-west and north-south vertical projections and height-time plots of the lightning activity. The color scale in this example represents the progression of time, blue being early in the flash and red being late (linear scale). The small boxes on the plan view detail the locations of the measurement stations.
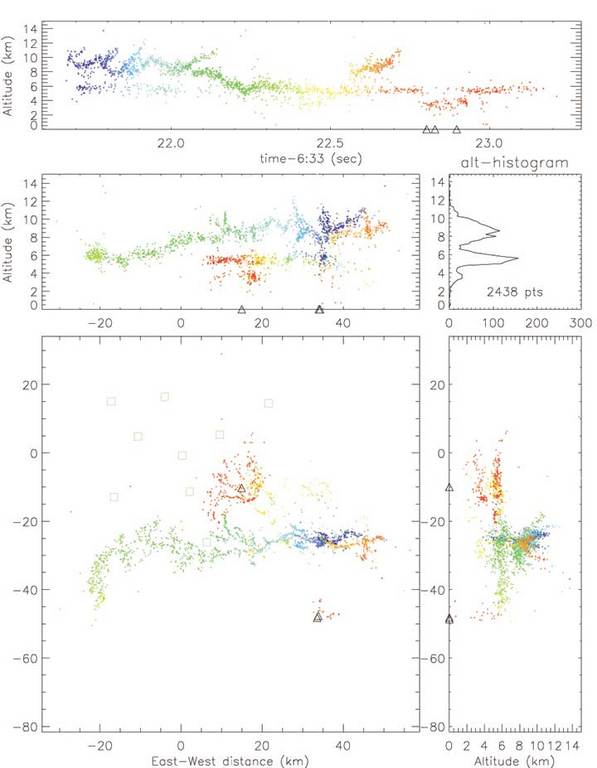
Figure 1. Lightning Discharge in Oklahoma
Figure 2 demonstrates the LMA's ability to view storms on much larger scales. This example is an integration of five minutes of data, where the color scale now represents event density, red being the highest activity and purple the lowest (logarithmic scale). Data of this type helps to determine the location of the main conective cells in storm systems, as well as determine the overall size and structure of the storm.
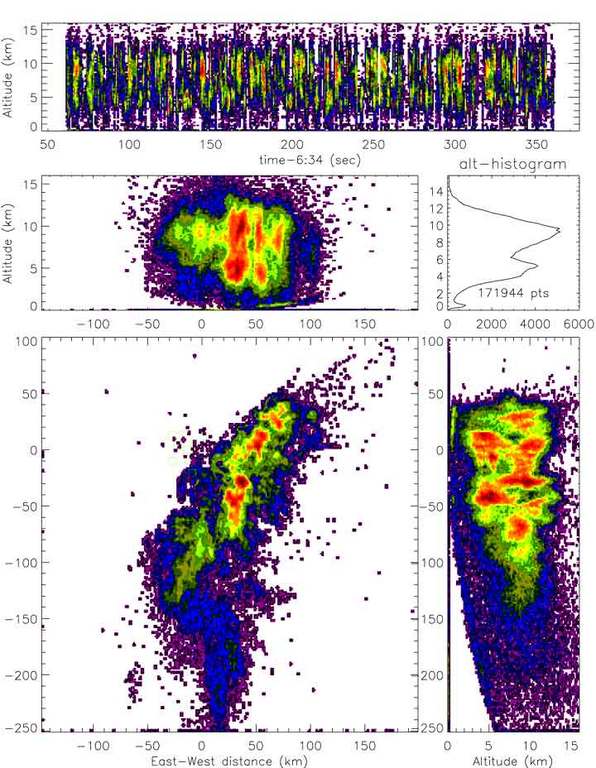
Figure 2. LMA Integration of Five Minutes of Data
At the very core of operation for this system is Linux. To best demonstrate the flow of data and Linux's involvement with it, we trace the stream from its source. An impulsive VHF event occurs, and the radiation from it arrives at a given remote station. Operating in each station is an inexpensive PC running Linux. Each PC has a custom-built digitizer card (built and designed here at NM Tech) which interfaces with the PC over the ISA bus. The arrival time and power of each event is recorded and stored into a 16-bit, 32KB-deep FIFO. The digitizer board sets a flag (or generates an interrupt) noting when the FIFO becomes half-full.
On the Linux side, there is a device driver (written in C) running, which polls for the half-full flag or can be set to utilize interrupts (they happen only a few times a second, so polling works quite well). When a half-full flag is detected, the driver initiates a block transfer from the FIFO to the system, where the data is then flushed to disk.
The digitizer board itself, which utilizes a microcontroller in conjunction with a programmable logic device (PLD) to maintain phase-lock with the GPS receiver (good to about 50-100 nanoseconds), must be configured using a passive-serial mode. This is accomplished by interfacing through the parallel port on the PC and clocking in the configuration data (one bit at a time) needed to program the PLD interface. A few calls to ioperm make this an easy task, and the availability of excellent Linux documentation helped greatly along the way.
The collection process goes on all the time, so data starts to build up on the remote stations. The data files are stored as fixed-length files, 10MB each. Once a file reaches 10MB, Perl scripting takes charge. The scripts perform a variety of actions. First, they take a completed file and write it to the local DAT tape drive. Currently the stations use DDS-II drives, so each tape can hold about 4GB of uncompressed data, which amounts to about a week's worth of data (depending on storm activity). After a successful write to tape, the file is moved to a backup location on the local disk as a redundancy method. The scripting monitors the tape writes, logs them and monitors hard-drive space. If drive space becomes limited, the oldest files successfully written to tape are removed. Data tapes are collected on a routine basis via the famed “sneaker net” and brought back to a central location for postprocessing.
It would be nearly impossible (although we have done it) to do this all blind. We take advantage of the ease of networking in Linux to achieve real-time control over the stations. Each remote station connects back to a central site via wireless radio modems operating at 115,200bps. The remote stations establish a PPP link between themselves and the main site; the PPP links are maintained quite easily with use of more Perl scripts. Having all of the stations networked to a central site, one which has Internet access, is a real benefit. This allows for control over the stations from virtually anywhere. All one has to do is get to the central site, and access to the remote stations is only an slogin away. Real-time control is invaluable; there are many things which need to be monitored and adjusted at each station, such as the triggering threshold of the digitizer, monitoring signal strength, checking battery backup status and controlling the GPS receiver.
Once the data have been collected at the central processing location, the real work begins. The data must be extracted from tape and combined for each station with corresponding time intervals. A workhorse machine is needed. We currently use a dual-processor Linux box running SMP. After combining the data, various forms of filtering must be done before the solutions can be obtained. A variety of languages and services help with the task: filters written in C, Perl and shell scripts for keeping track of vitals, more C to invert the data, IDL to display the data, HTTP and FTP servers to collaborate with others and so on.
In the works is a transition to full real-time processing, which is well underway. We hope to eliminate the sneaker net and bring all data back real time, process it and archive it all in one place. This will reduce the number of man hours considerably, as well as make the system a more effective tool in collaborative field campaigns.
Linux has proven to be an important part of every aspect of this project. The ease of development on this platform is unparalleled, as is its flexibility of application. The prodigious documentation, as well as the massive proliferation of freely distributed software, has made it our OS of choice. We could not do what we do without it! It should also be mentioned that the PCs in the remote stations are up constantly—the last /proc/uptime reports over 300 days since the last reboot. Show me a Windows box that can run for nearly a year, network constantly, and archive over 100GB of data without so much as a hiccup!

Timothy Hamlin (thamlin@nmt.edu) has been a graduate student in physics at NM Tech for the past three years, and hopes to complete his Ph.D. sometime before the next millennium. He has been an avid UNIX user for over 10 years and a Linux convert/administrator/programmer/what-have-you since 1996.
