
Matlab—A Tool for Doing Numerics
The first time I heard about Matlab was when DOS 3.3 was popular and my dad received a demo version on his PC. I played around with it a bit, but soon lost interest because there was no manual and I did not have any real use for it.
The second encounter was about three years ago when I attended a lecture on numerical mathematics. Some of the exercises the students had to hand in were intended to be solved with Matlab. There was even a handout describing the basic functions of the program. As is usually the case with exercises, numerical homework tends to be very time-consuming, so again I did not spend much time on it. Soon thereafter, I installed Linux on my then new PC.
The third time I came into contact with Matlab was during my diploma thesis. All serious data evaluation in the group where I worked was done using Matlab—not on UNIX, but on a Macintosh.
I asked whether I could bring my until-then “unplugged” Linux box to the lab and network it. I got an IP number and a weekend later the first Linux computer of our group was up and running.
Campus licenses are available for various software and I was quite happy to find Mathematica, Maple and Matlab for Linux. Shortly afterwards, I was running the already-existing Mac-Matlab scripts on my computer.
Matlab is a command-line-driven program specializing in all types of matrix manipulation. Everything in Matlab is expressed using matrices; even a scalar can be thought of as a 1x1 matrix.
The first noncommercial version of Matlab was based on LINPACK and EISPACK routines. Since then, much has changed and Matlab is now one of the fastest packages available for numerical computation.
When Matlab is started in an xterm, a prompt appears after a brief display of the logo in a separate window. Basic editing is possible, though the spoiled Linux user might miss tab completion. (A sophisticated tab-completion feature recognizing file names would be great.)
A nice feature of Matlab is the ability to cluster data into compounds similar to structs in C, but it is not necessary to define them in advance. One simply adds fields to a variable, i.e., data.Temp might be the temperature at which a measurement was taken, and data.B is a vector containing the values of the magnetic field at which the Hall resistivities data.rxy were measured. Adding a string data.date='July-4th-1999' is not a problem, either. Going a step further, it is even possible to use object-oriented features.
For complex tasks involving more than two or three commands, one can write scripts or functions. The difference between them is that scripts are executed as if they were typed at the command prompt, whereas functions use private memory with local and global variables, and of course, can have multiple return values. The syntax loosely follows C and makes scripting relatively straightforward.
It is even possible to implement graphical front ends for your Matlab application with all different kinds of buttons, sliders and levers, as shown in Figure 1.
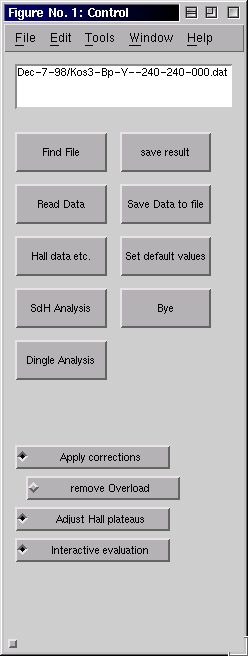
Figure 1. A front end programmed in Matlab. More complicated dialogs are possible by combining buttons, sliders and graphs.
The interface used in the Linux version is extremely simple compared to the Windows or Macintosh version. No editor is provided for scripting, so the user has to stick to Emacs or some other editor. I personally use XEmacs in Matlab mode with syntax highlighting. The mode was written by Matt Wette and can be found at ftp.alumni.caltech.edu/pub/mwette/matlab.el. As far as I know, there is even a mode for GNU Emacs which makes it possible to run a Matlab session within the Emacs window.
Debugging scripts is not nearly as comfortable as in the Windows or Macintosh environment, where the editor windows have buttons for running the script stepwise. Instead, debugging has to be done by issuing commands for setting breakpoints, etc., on the command line. Mathworks could make big improvements by adding, for example, a window with Step In/Over/Out buttons with a display showing the next command and offering the option of adding breakpoints.
In my opinion, it should be rather straightforward to implement this in Tcl/Tk with the script sending the specific command to the command line. An inspection window for variables would also be a neat feature, one that, to my knowledge, does not even exist on other platforms.
Separate windows are used to display graphics. There is a vast variety of different kinds of plots ranging from simple bar charts to color-shaded 3-D plots with different light sources. Every aspect of a plot can be controlled by setting the appropriate variables. Since 5.3, it is possible to edit a graph directly with a simple point-and-click interface.
A very handy feature is the support of LaTeX-like syntax for text-in-graphics windows.
Exporting images to encapsulated PostScript is possible, although importing the file into, e.g., a (La)TeX document might not lead to the desired result, especially if there is extra text in the figure. Matlab uses fixed-size fonts, so scaling the picture can result in odd-looking tick labels. Therefore, an export mode where text and graphics are written into separate files as in XFig and Xmgr would definitely find friends in the (La)TeX community. For publications, I still export the processed data and import it into Xmgr.
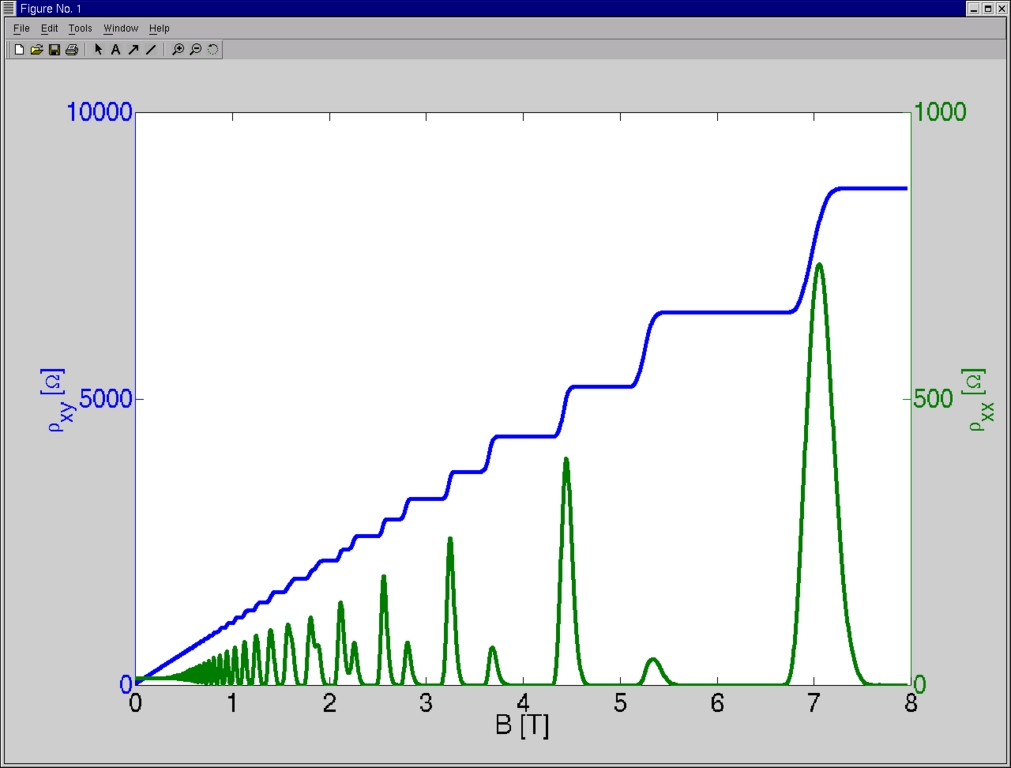
Figure 2 shows the trace of a hall measurement in the two-dimensional electron gas of a GaAlAs heterostructure. The plot was obtained from the commands issued as shown in Figure 3.
Platforms in Matlab do not matter. The only problem that might arise when copying scripts from one platform to the other is CR/LF conversion.
A colleague of ours recently had a problem with a Macintosh at work. It did not have enough memory to display a large matrix, so she issued the command save which stores the current state in the file matlab.mat, copied the resulting file to our Linux server, loaded it under the Linux version of Matlab, and continued her work on Linux.
After the uproar in the Linux community concerning the Mindcraft report, I could not resist running a benchmark with Linux and MS Windows 98. The command bench(N) is a Matlab script that times five different tasks from different fields of numerical math and graphics. Data structures and general math are tested by solving ordinary differential equations (ODE). Floating-point values are the main issue of the Linpack part (LU), sparse matrices mix both integer and floating-point calculation (Sparse), 3-D graphs test z-buffering, and 2-D graphics test line drawing. The parameter N gives the number of times a test is performed. The higher the number, the more reliable the test.
The results of bench(100) are shown in the first two lines of Table 1. The system the test was run on is a 133MHz Pentium with 32MB of RAM. Linux is a bit slower in all cases except when it comes to 2-D graphics, where it is faster. The reason for this might be that the graphics driver for Linux is better than the generic Windows driver. I did not bother to install all possible drivers since VMWare (see “VMWare Virtual Platform” by Brian Walters, July 1999) is now available, and I won't need to reboot the machine any more in order to read an Excel spreadsheet. I installed this PC emulator on our server which has a 400MHz processor and 128MB of RAM. Just for fun, I ran the same benchmark in the emulator and directly on Linux. The results are listed in the remaining lines of the table.
Features in the user interface could be drastically improved—a user-friendly debugger would be great.
I was amazed by the quick response I got from the Matlab newsgroup (comp.soft-sys.matlab). Matlab engineers seem to frequent the forum quite often and provide immediate help and support.
To put it all together, Matlab for Linux is a very useful tool for doing numerical mathematics with a wealth of toolboxes, including signal processing, symbolic computation, financial mathematics and others.
Tobias Vançura (tvancura@solid.phys.ethz.ch) studied physics in Kaiserslautern and Zurich where he is now working on his Ph.D. in semiconductor physics. In his group, he is responsible for a heterogenous computer network consisting primarily of Macintoshes, one NeXT cube, some PCs running most available versions of Windows, and of course, Linux. In his spare time, he loves snowboarding and skiing in winter and tennis in summer.
