
GNUPro Toolkit for Linux v1.0

Manufacturer: Cygnus Solutions
E-mail: info@cygnus.com
Price: $79.00 US
Reviewer: Daniel Lazenby
GNUPro Toolkit for Linux is designed for developing both commercial and noncommercial Linux applications on native Linux platforms. It is a set of tested and certified, open-source, GNU standard C, C++ and assembly language development tools. The reviewed release of the product (v1.0) is a Linux-only product. This packaging of the Toolkit is specifically targeted toward the Linux desktop developer.
The compiler and development tools consist of GNU's C compiler (ANSI conforming), C++ compiler (ANSI tracking), assembler, C preprocessor, linker, debugger and the GNUPro visual debugger. The GNUPro libraries include standard ANSI C runtime, math subroutine libraries, C++ class and C++ iostreams. All of the compiler and development tools, except gdbtk, are command-line tools. (gdbtk brings up the GNUPro visual debugger). The other command-line tools function like standard GNU tools.
A set of binary and general utilities is also included. Tools such as objcopy, objdump, ranlib, strip, ar and nm are examples of the included binary utilities. The general utilities provide a set of tools for comparing and merging files. Tools such as cmp, diff, diff3, sdiff and patch are included in the general utilities.
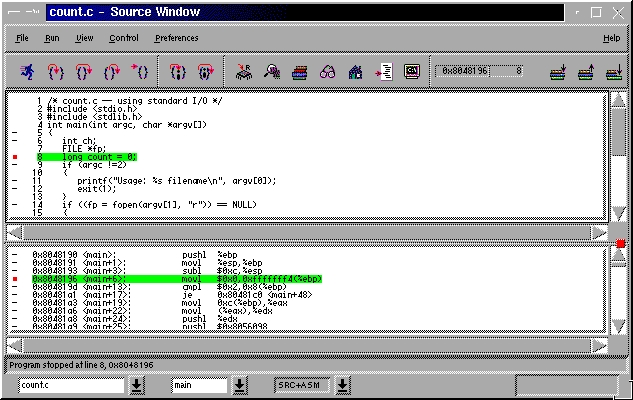
For me, GNUPro's visual debugger makes debugging easier. I like being able to see graphically what is happening. Figure 1 contains a KDE environment screen capture of the debugger's Source Window.
Figure 1. Source Window for the Debugger
Typical menu, tool, display window and status bars are provided. The tool bar provides run, stop, function navigation and assembler navigation buttons. Then there are the register, memory, stack, watch expressions, local variables, break points and console dialog box buttons. These buttons are followed by the stack navigation buttons. Each of the function buttons implements or executes a GNU gdb command-line interface command. The dialog buttons open windows that display related information. The Register Window button dynamically displays registers and their content. Memory is dynamically displayed in the Memory Window. The current state of the call stack is displayed in the Stack Window. The Source Window will update its display to reflect any selections made in the Stack Window. An “expressions to watch” window is displayed by the Watch button. This window will be blank unless expressions, registers or pointers have been identified for watching. Current values of local variables are displayed in the Local Variables Window. A list of all defined breakpoints is shown in the Breakpoint Window. Another way of managing breakpoints that may not be readily visible/accessible in the Source Window is provided by the Breakpoint Window. A Console Window is displayed by the console button. This window provides a command-line interface to GNUPro Debugger.
A mouse click or static cursor within the Source Window produces several pieces of information. The current value of a variable is displayed when the mouse cursor is held over a variable. Holding the cursor over a variable and right-clicking the mouse produces a pop-up menu. This menu offers two choices: add the item to the watch list, or dump the memory. Selecting either of these produces a dialog box displaying the selected information. Executable lines are shown with a minus sign on the left side of the window. Left-clicking the mouse in this region will either add or remove a break point. Right-clicking the mouse offers a pop-up menu with a couple of break point management options.
Below the status line are three drop-down list boxes. All of the source and header files associated with the executable are presented in the left-most box. The middle box displays all functions in the source or header currently displayed. Any of the items in these two list boxes may be selected for display. Four items in the right list box control what is being displayed. The display options are source only, assembly only, source and assembly mixed, and a split screen with source on top and assembly at the bottom.
Version 1.0 for Linux of GNUPro has been tested and is officially supported on Red Hat version 4.2 and 5.x. GNUPro also works with Red Hat version 6 and SuSE version 6.0/6.1. Plans for the next release of GNUPro for Linux include testing and support on distributions other than Red Hat and SuSE. The install files provided on the review package distribution CD-ROM media were for Red Hat versions 4.2 and 5.1.
Installation of GNUPro on Caldera's v1.3 required a little experimentation, some research and thinking. Cygnus FAQ pages indicated GNUPro should install on Caldera, Debian and other Linux distributions. With this positive reinforcement, I began installing the product on a 300MHz Pentium with 64MB RAM and Caldera's OpenLinux version 1.3 with KDE.
The Red Hat version 5.2 install file produced a list of missing dependencies. It turned out the Red Hat v4.2 install file had just one missing dependency. The version 4.2 install file was looking for libncurses.so.3.0. OpenLinux had a later release than the install program expected. The install program would not accept either a soft or a hard link to libncurses. The Cygnus bug list web page suggested a way around this specific problem. I got around ncurses hurdle by installing GNUPro using the nodeps option. After the install had completed, I made a soft link between libncurses.so.3.0 and libncurses.so.4.1. Once the link had been established, the installation verification tests executed successfully .
In general, Cygnus support was prompt, responsive to my questions and to the point. In response to one question, they provided some additional information in case I might be considering upgrading to glibc 2.1.
According to the GNUPro Getting Started Manual and FAQ, HTML copies of the six GNUPro documents (Compiler Tools, Debugger, Libraries, Utilities, Advance Topics and Tools for Embedded Systems) were included on the distribution CD-ROM. I was unable to locate any HTML documentation on the CD-ROM. After roaming about the GNUPro installation directories, I located HTML documentation files in my install directory /usr/cygnus/redhat-980810/doc. Cygnus support indicated that the User Guide's reference to documentation is being corrected.
The on-line documentation is in HTML format. It requires a web browser or some other application able to read HTML files. On my system, I chose to use kfm to access and display the GNUPro HTML documentation.
GNUPro Toolkit for Linux is a single-release snapshot of the ever-evolving GNUPro product. Support for the Linux product includes 30 days of installation support and a web page. The support web page contains PDF and HTML documentation, FAQs, patches and a known bug list. E-mail notification whenever the patch or bug list pages change may be requested.
The 30-day support is for installation problems. After a successful product install, one should not expect a personal reply to non-installation support questions. At the time of this writing, the primary after-installation support vehicles are the Cygnus web site, newsgroups and mailing lists. No information on upgrade policies for GNUPro for Linux was available.
A quick comment on GNUPro legal notices. GNUPro Toolkit consists of software from several different sources. The terms and conditions for copying, modifying and redistributing software components derived from GNUPro vary. The User's Guide devotes a short chapter to the various legal notices.
While this review was specifically about GNUPro Toolkit for Linux, I would be remiss if I did not briefly mention Cygnus' GNUPro Toolkit product. The more robust, and more expensive, GNUPro Toolkit is capable of supporting more than 125 hardware and software environments. A wide range of host systems may be used to develop 32- and 64-bit applications for this array of target hosts and operating systems. Some of the many major hardware and software players represented include HP, SGI, Sun SPARC series, Hitachi, MIPS, NEC, Panasonic, Toshiba, Motorola, IBM RS6000 and PowerPC and Intel's X86 series, to name a few. The Toolkit contains embedded cross-platform compiling capabilities. No cross-platform capabilities were included with the reviewed Toolkit for Linux version. Cygnus has identified Linux as one of its target host environments, so cross compiling should be on the horizon.
Cygnus offers a GNUPro subscription service for the high-end GNUPro Toolkit product. This service provides two releases of GNUPro each year, and access to Cygnus Developer Support. Additional information on pricing and Developer Support services may be obtained by contacting Cygnus.


