
Linux Clusters at NIST
The National Institute of Standards and Technology (NIST) is experimenting with clusters based on commodity personal computers and local area network technology. The purpose of the experimental phase of the cluster project is to determine the viability of using commodity clusters for some of the NIST parallel computing workload. In addition to a Cray C90 running sequential codes, many parallel jobs are run on IBM SP2, SGI Origin 2000, SGI Onyx and Convex supercomputers.
Building clusters to run parallel jobs is done for several reasons. Low initial cost is one, although it is not clear how the long-term costs associated with clusters compare with those of traditionally packaged systems supported by manufacturers. Another reason is availability of systems. Having a slower system available without needing to wait is sometimes better than waiting a long time for access to a faster system. A third reason is that free implementations of the parallel virtual machine (PVM) and message passing interface (MPI) environments are available for Linux. Many NIST parallel applications rely on PVM or MPI.
Figure 1 shows a diagram of the current cluster. Currently, there are 48 machines (nodes) in the cluster; 32 nodes have a 200 MHz Pentium-Pro microprocessor, and 16 nodes have a 333 MHz Pentium II microprocessor. The Pentium-Pro machines are built around the Intel VS440FX (Venus) motherboard, which uses a 33 MHz PCI bus and has four SIMM memory slots. The Pentium II machines use a motherboard based on the Intel 440LX chip set, also with a 33 MHz PCI bus, and 3 DIMM slots for memory. All of the nodes are configured with a single 2.1GB hard disk supporting 512MB of swap space and the file systems. Sixteen nodes have 128MB of memory and 32 nodes have 256MB, for an aggregate total of 10GB of memory.
Sixteen of the cluster machines are connected with both Fast-Ethernet and ATM. The remaining 32 machines are connected with Fast-Ethernet only. Therefore, the cluster can be configured with up to 48 Fast-Ethernet nodes or up to 16 ATM nodes, depending on the requirements of the job to be run. One other Pentium-Pro machine is used as an administrative front end to the cluster. This machine has both Fast-Ethernet and ATM interfaces.
The ATM interface cards are Efficient Networks ENI-155p with 512KB of memory onboard. These nodes are connected to a Fore ASX-1000 switch over OC-3 (155Mbps), using multi-mode fiber. For Fast-Ethernet, we use SMC EtherPower 10/100 and Intel EtherExpress 100+ cards connected to one Ethernet switch: an N-Base MegaSwitch 5000 with 60 Fast-Ethernet ports. The cabling to the switch is done with Category 5 twisted-pair cable. The Ethernet switch is connected to the intra-NIST network via a 100Mbps uplink to a router. Both the ATM and Fast-Ethernet interfaces are configured into different subnets, allowing us to monitor the network traffic independently. There is very little background traffic on the cluster subnets, since the nodes are used only for parallel application programs. Keeping non-computational network traffic to a minimum is important when evaluating the cluster network.
The cluster nodes have been augmented with the NIST-developed MultiKron performance measurement instrumentation (see Resources 6 and 7). The MultiKron PCI board is equipped with a MultiKron VLSI chip, a high precision clock and 16MB of memory. These features allow for precise interval measurement and storage of trace data with little perturbation. Another advantage of MultiKron is that the clocks on several boards (up to 16 at present) can be time-synchronized, allowing for tracing of events across the cluster with 25-nanosecond resolution. This type of measurement is important for precise tracing of network events.
The 32 Fast-Ethernet-only cluster nodes are running Linux kernel version 2.0.29. We've found this version to be the most stable for our configuration. However, because support for the Intel EtherExpress 100+ is not in this kernel release, the device driver is built as a module. The 16 ATM/Ethernet nodes use Linux kernel 2.1.79, as this release is required for the ATM software version in use.
Development and support for the ATM software comes from the Linux-ATM project run by Werner Almesberger at the Swiss Federal Institute of Technology (EPFL). (See Resources 2.) We are currently running version 0.34 of this software, having started with version 0.26.
We installed Local Area Multicomputer (LAM) (an implementation of MPI) version 6.1 and Parallel Virtual Machine (PVM) version 3.10 on the cluster in order to run our benchmarks in addition to the NIST parallel jobs.
We also developed a device driver to allow for user-mode programs to control the performance counters present in the Intel Pentium-Pro and Pentium II processors. Two performance counters are present in the Intel Pentium-Pro architecture, along with a timestamp counter. Each counter can be configured to count one of several events, such as cache fetches and instruction executions. (See Resources 3.) The device driver is required because writing to the counter control registers (and the counters themselves) can be done only by the Linux kernel. User-mode programs can directly read counter values without incurring the overhead of a kernel system call to the device driver.
Another tool we use on the cluster is S-Check (see Resources 5), developed by our group. S-Check is a highly automated sensitivity analysis tool for programs. It predicts how refinements in parts of a program will affect performance by making local changes in code efficiencies and correlating these against overall program performance.
We have written many small test kernels to evaluate the performance of communication within the cluster. We have versions of the test kernels that communicate at the raw socket, IP and LAM/PVM library levels. These small kernels are useful in evaluating the overhead of the different communication software levels. By using the MultiKron toolkit, the kernels obtain very precise measurements of network performance.
The first step in assessing the performance of the cluster was to determine the performance of the cluster nodes in terms of memory bandwidth. Memory and bus bandwidth performance can limit the effective use of the network bandwidth.
We used a NIST benchmark, memcopy, to determine the main memory bandwidth of the cluster nodes. For buffer sizes greater than the cache size but smaller than main memory size, the size of the buffer transferred did not affect the transfer rate. On the 200 MHz Pentium-Pro machines, we measured a peak transfer rate of 86MBps (672Mbps). On the 333 MHz Pentium II machines, the measured rate was 168MBps. Both of these rates far exceeded the line speeds of the ATM and Ethernet networks. Therefore, memory bandwidth is not a factor in utilizing the peak transfer rates of the network.
We measured the throughput and latency of the network using netperf (see Resources 4) and our own test kernel called pingpong. Using pingpong along with the MultiKron allowed a direct and precise measurement of the latency between cluster nodes. netperf was used to measure TCP and UDP performance, while variations of the pingpong program were used to measure the performance of the LAM, TCP, UDP and ATM socket levels.
Using the netperf stream benchmarks to measure throughput, we measured a peak rate of 133.88Mbps (86% of the OC-3 line rate) for TCP/IP over ATM. For TCP/IP over Ethernet, we measured 94.85Mbps (95% of the line rate). Both of these rates are near the maximum payload rate for the respective networks.
Measuring throughput with the pingpong program provided more insight into the network performance. While the netperf results tended to produce smooth curves, much more variability in the throughput was seen with pingpong as the message size increased. For messages below 16KB, Fast-Ethernet performed better than ATM when using TCP/IP. At this message size, Fast-Ethernet is near its maximum throughput, while ATM is not. With messages larger than 16KB, ATM throughput increases to surpass Fast-Ethernet.
While running the throughput tests, we noticed that the TCP/IP throughput drops dramatically when the message size is near 31KB. By using the MultiKron toolkit to probe the network stack in the Linux kernel, we were able to find the cause of the throughput drop. With the Linux 2.0.x kernels, transmission of the last message segment is delayed, even though the receiver window has opened to include room for the segment. We modified the kernel TCP software to prevent this delay, resulting in the elimination of the performance dip. (For details, see http://www.multikron.nist.gov/scalable/publications.html.)
Table 1. Network Latency (µs) for Message Size of 4 Bytes
To measure the latency of message transmission, we sampled the synchronized MultiKron clocks on the two cluster nodes involved in the data transfer. The latency is the time required for a minimum length message to be sent from one node to another. Table 1 gives the results of the measurements for different layers of the network stack. The values given are the one-way times from sender to receiver. Therefore, the TCP/IP measurement includes the device driver and switch time as well. Likewise, the device driver measurement includes the switch time.
Table 2. Ethernet Switch Latency (µs) for Various Message Sizes
The latency added by the ATM switch is greater than that of Fast-Ethernet for small messages. However, as message size grows, so does the latency added by the Fast-Ethernet switch, while the ATM switch latency stays constant. Table 2 shows the application layer latency when sending various-sized packets, using both the Fast-Ethernet switch and a crossover wire. As can be seen in the table, the latency added by the switch is between 123 and 131 microseconds. These latency values were consistent for several switches from different manufacturers. The cause is the buffering of each frame until it is completely received, rather than buffering only the header bytes, then overlapping the send and receive after the destination is determined from the frame header. (We have confirmed this with one switch manufacturer.) Although the latency is constant for each packet, it is easily hidden by pipelining for all but the first packet in a burst.
We have run several NIST applications on the cluster. Most of these applications are computation-bound, with little disk access. One exception is a speech processing job described below.
Our speech processing application is a batch job submitted piecemeal to each cluster node from a central server. This job was used to process over 100 hours of recorded speech. The processing involves analyzing the speech to produce a text translation. The job ran for nearly three weeks with little interruption on the cluster. The total CPU time used for the processing was over 42 million seconds across the 32 cluster nodes. Each piece of the job transfers 50MB of data from the central server via the Network File System (NFS) before starting the computation. Linux NFS has proven to be very stable. Overall, 6464 sub-jobs were run as part of the speech processing application, with 98.85% completing successfully.
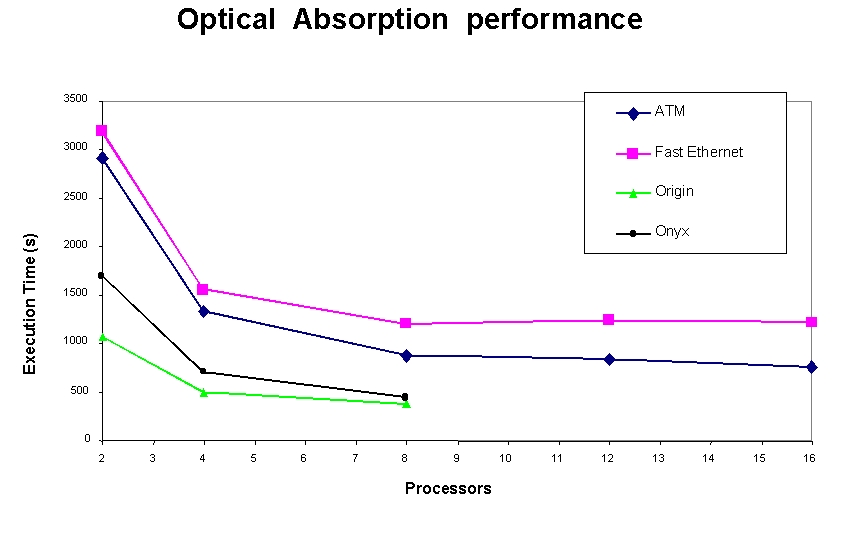
Another NIST application run on the cluster, OA, predicts the optical absorption spectra of a variety of solids by considering the interaction of excitons. The bulk of the computation is based on a fast Fourier transform (FFT)/convolution method to calculate quantum mechanical integrals. The OA application was run on the cluster as well as Silicon Graphics (SGI) Origin and Onyx systems. Figure 2 shows the execution time of the OA application on the SGI and cluster systems. The best runtime occurred on the 8-node Origin, at 500 seconds, while the runtime on the 8-node ATM sub-cluster was 900 seconds. For the 16-node ATM sub-cluster, the runtime was only slightly better, showing that the application does not scale well beyond 8 nodes. The results show nearly a factor of two performance difference between the cluster and the Origin for this application, while the cost differential is more than a factor of ten. Running the job using the ATM network decreased the runtime by 30% compared to the Fast-Ethernet network, where the runtime was 1300 seconds. This difference is due to the higher throughput obtainable over ATM.
Figure 2. Optical Absorption Performance
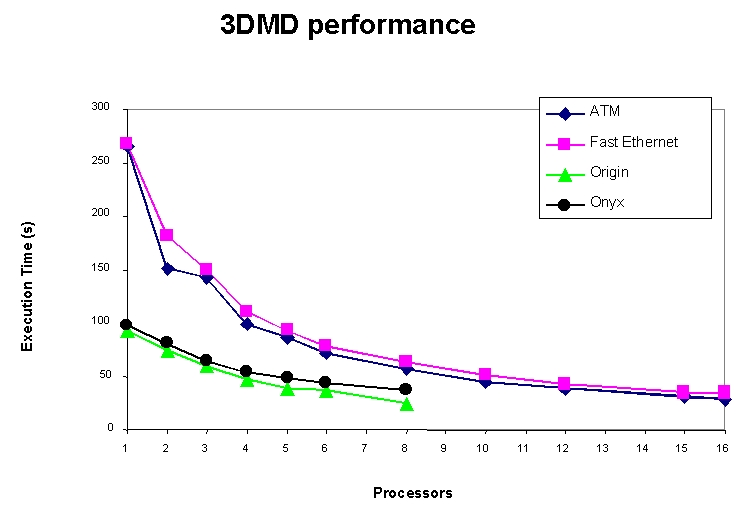
The third NIST application, 3DMD, implements a three-dimensional matrix decomposition algorithm to solve elliptic partial differential equations. This application is considered “course-grained” because it generates large (100KB or more) messages at infrequent intervals. This application scales well as more nodes are added. Figure 3 shows the execution time of 3DMD on the SGI parallel computers and the cluster. With 16 cluster nodes, 3DMD ran faster than with the 8 Origin nodes (the maximum available on the Origin). For this application, there is a 10% performance difference between ATM and Fast-Ethernet, with ATM performing better.
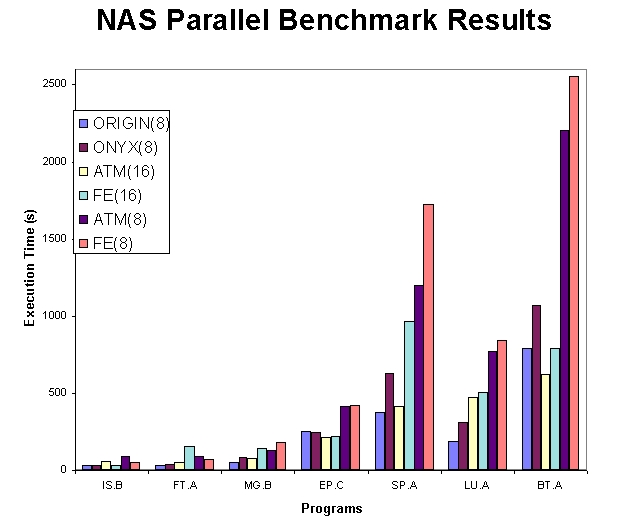
Figure 4. NAS Parallel Benchmark Results
Figure 4 shows the execution time of the Numerical Aerodynamics Simulation (NAS) parallel benchmarks (see Resources 8). The NAS benchmarks are packaged as a suite of programs designed to measure the performance of parallel computers on computationally intensive aerophysics applications. The NAS suite is written in FORTRAN 77 using the MPI communication standard (distributed memory). The figure shows execution times for the NAS example problems when run on the 8-node SGI Origin, 8-node SGI Onyx and 8- and 16-node cluster using both Fast-Ethernet and ATM. The number in parentheses following the machine name gives the number of processors used for the problem run. The cluster competes well with the traditional parallel machines and ATM has an advantage over Fast-Ethernet for several of the benchmarks.
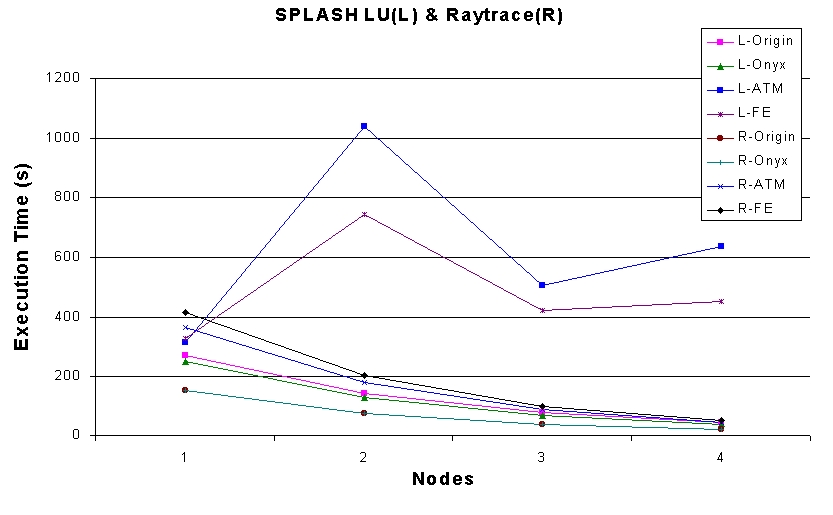
The second set of benchmarks we ran were the Stanford Parallel Applications for Shared Memory (SPLASH) (see Resources 9). This benchmark suite differs from NAS in that SPLASH utilizes shared memory as opposed to distributed memory. In order to run the SPLASH suite on the cluster, we used the TreadMarks (see Resources 10) Distributed Shared Memory (DSM) system. TreadMarks emulates DSM via the Network File System. Figure 5 shows the execution times for two of the SPLASH programs, Raytrace and LU. Raytrace consists of mostly computation, with very little communication, while LU spends a large percentage (nearly 35%) of its time communicating. The graph shows that for Raytrace, the cluster performs very well; however, for LU, cluster performance does not compare favorably with the parallel machines. This performance gap is due to the high communication overhead for small messages incurred on the cluster for the LU application.
Figure 5. SPLASH LU (L) & Raytrace (R)
The purpose of running the NAS, SPLASH and other benchmarks is to get a feel for the types of applications a cluster can run effectively. Also, for applications similar to the SPLASH LU, where communication time is the major factor in runtime, we need to delve deeper into the Linux network software and determine how network performance can be improved for these types of applications.
One other application for the cluster is the Distributed.NET project (see http://www.distributed.net/). During periods of low activity, the RC5 encryption software is run on the cluster nodes. Each node runs the software independently of the others, so we can participate with any number of nodes. We have run all 48 nodes (plus the front end) at times, with an aggregate key processing rate of over 32 million keys per second.
Linux has been beneficial in our research. The first device driver for the PCI MultiKron card was done on Linux and was the easiest to write. We use Linux to monitor the cluster, and the tools we develop are either written for Linux first or ported quickly from other UNIX environments. Experimenting with computing clusters would be more difficult with commercial operating systems because source code is generally not available. By having the ability to probe the operating system source code, we are able to accurately measure performance of the OS in addition to the performance of our applications.
Our experiments show that clusters compete very well with traditional parallel machines when running distributed memory applications, generally characterized by large messages. For shared memory applications, which tend to communicate with many small messages, the overhead of the network has a detrimental effect on the application performance. For both types of applications, tuning the network parameters can be of tremendous benefit in decreasing execution time.
The 333 MHz, 16-node Pentium-II cluster has been transferred into a production environment. This cluster will be made available to the entire NIST community and will be managed by the group that supports the traditional supercomputers. We believe Linux-based clusters will provide an effective environment for running many high-performance applications.
Wayne Salamon is a Computer Scientist within the Information Technology Laboratory at the National Institute of Standards and Technology in Gaithersburg, MD. He has worked on system software for PCs, UNIX workstations and IBM mainframes for the past 12 years. His current research interests are parallel computing and performance measurement. Wayne can be reached at wsalamon@nist.gov.
Alan Mink is project engineer of the Distributed Systems Technology project within the NIST Information Technology Laboratory. He holds a B.S. in Electrical Engineering from Rutgers University and an M.S. and Ph.D. in Electrical Engineering from the University of Maryland. His research interests include computer architecture and performance measurement. Alan can be reached at amink@nist.gov.

