
DDD—Data Display Debugger

One of the most common uses for Linux today is as a platform for program development. The rich suite of GNU software that comprises this platform is one of the most comprehensive development environments in existence. However, one universal quality of these tools has been both the reason for their success and their weakness when competing with other products—the character or command-line based interfaces.
On the other hand, a character-based interface requires that the user be familiar with its intricacies. New users are usually baffled because they don't know the magic commands and keystrokes. For this reason, many commercial programming suites provide an integrated windows-based environment. This almost always severely limits the programmer' use of tools—For instance, it may be impossible to use the tool in a script. Vendors consider these limitations a small sacrifice to make when the gain or loss of a new user is at stake.
The Unix environment has long lacked freely available, graphical, easy-to-use programming tools. The ddd command addresses this lack of graphical tools by providing a graphical user interface for the Unix debuggers gdb and dbx.
The debugger is an essential part of any programming environment, providing two basic capabilities:
Running a program interactively in order to observe the code execute and test for bugs
Examining the core dump of a crashed process
The standard Linux debugger is gdb, the GNU debugger. gdb provides an interactive text-base method for accomplishing those two tasks, including step-by-step execution, breakpoints, variable watch and other options that are expected in a full-fledged debugger. However, gdb is not easy to run—lots of experience is needed to fully operate gdb, and even then it tends to be somewhat awkward. To the rescue comes ddd—an X Windows front end to both the gdb debugger and the dbx debugger.
The ddd homepage is at http://www.cs.tu-bs.de/softech/ddd/, and the latest version (as of writing) is ddd 2.1.1. ddd requires Motif to execute; however, the latest versions apparently compile and run fine with the free Motif clone, Lesstif. Also, a statically-linked version of Motif is provided, although it is a very large binary that will hog memory. After compiling ddd (or downloading the binary), place the binary in a convenient location (/usr/local/bin, for example).
ddd is a front end—it doesn't do any debugging. Instead, it sends all user commands to an actively running gdb (or dbx) process. The ddd environment consists of four important windows:
The “Debugger Window” contains the actual communication between gdb and ddd. This window always displays the standard I/O of the debugged program.
The “Source Window” contains the program source and the basic source debugging actions.
The “Command Tool Window” contains buttons for most of the actions you'll need; stepping up and down stack, setting breakpoints, etc.
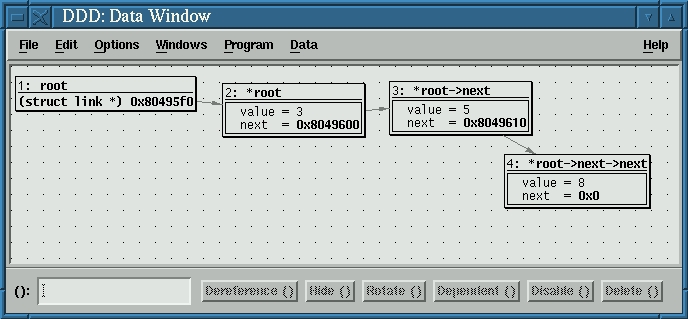
The “Data Window” contains all data-related information, such as variable and function watching.
To use ddd, write a program and compile it, using the gcc command with the -g switch set so that debugging information is included.
gcc hello.c -g -o hello
Then run ddd. Upon startup, only the debugger console opens. You must open the executable (or core dump) via the File menu; then, open the Command Tool Window and the Source Window. If you wish to manipulate data as well, open the Data Window via the Window menu.
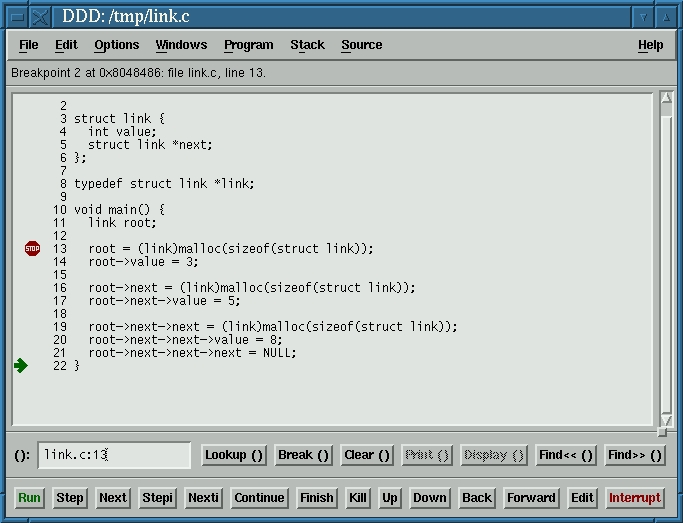
At this point you can start running the program and diagnosing any problems. First, set a breakpoint, a line of code at which the debugger should stop running the program and wait for instructions. Click on a code line and then set the breakpoint by clicking the Break at() button; a “red stop sign” appears next to the line to mark the breakpoint. You can clear it at any time by clicking on the line and pressing the Clear at() button.
Start running the program by clicking the Run button in the Command Tool Window. The program executes, just as if you had started it at the prompt, but stops immediately on reaching the first breakpoint. Now you can continue program execution line-by-line in one of two ways—Step and Next. Step executes the line of code, and if that line is a function for which the code exists, Step enters the function code and steps through it. Next executes the function and proceeds to the next line. Note that a “green arrow” marks the line that is to be executed. After moving through the program code using Step and Next for a while, you can press the Continue button to continue running the program until the next breakpoint is reached or until program end, if no more breakpoints are set.
Executing portions of code and playing around with breakpoints can be nice, but there's substantially more to debugging. A vital part of debugging is observing how the program manipulates data. Since ddd is a graphical application, it can contribute most where data visualization is used.
Begin debugging a program that manipulates variables by opening the Data Window. During the debugging process, select a variable by clicking the left mouse button on it and then press the Display() button; the variable and its value will appear in the Data Window. Executing any line of code that modifies that particular variable changes the representation in the Data Window. You can, of course, create more than one variable “watch” and even position them in the window as you like. You can create a function watch by clicking the right mouse button in the Data Window and then choosing New Display. With this option you can enter any valid C expression and have it evaluated.
Variable and function visualization is not unfamiliar to gdb users. However, one of the most amazing things in ddd is visualizing pointers; for example, create an integer pointer and have it point to an integer. Create a watch on the pointer. In the content section of the watch, you will see the memory address of the integer pointed at. Click on the content and then click the Dereference() button. At this point a new cell is created, containing the integer variable, with an arrow extending from the pointer to the integer. Taking this concept a little further means that you can graphically visualize complex data structures, structures, arrays and almost anything you wish. For example, Figure 1 displays the source code for a linked list, while Figure 2 displays the ddd visualization of it.
Another worthy feature of ddd is its help system—a very useful context-sensitive mechanism, help can be tapped by pressing f1 and then clicking anything in ddd. Additionally, a more complete and methodical manual can be opened from the Help menu, offering menu-based text pages with examples.
ddd has more features than I have covered here; however, this article should give you a good start. It is refreshing to see Unix enter the modern era with graphical front ends which do not limit the user. When I first found ddd, I was quite impressed at its potential for novice Unix programmers. However, I also find myself firing it up quite often, even though I am a fully “qualified” Unix hacker with many gdb scars. The simplicity and elegance of ddd will make even the most die-hard shell fanatic roll over and accept it in many situations.
Shay Rojansky is an 18-year-old high school student about to be drafted into the Israeli Defence Forces (IDF), where he hopes to push Linux as an OS. He sometimes works in his high school as a system administrator (mainly Linux). He can be reached via e-mail at roji@cs.haji.ac.il.
