
The Yorick Programming Language
Linux leverages a vast amount of academic software, either easy ports of existing UNIX packages or, increasingly in recent years, software that is ready to run under Linux. One example is Yorick, and this article is an attempt to provide a brief overview of the nature and capabilities of this system.
Yorick is not just another calculator. Readable syntax, array notation and powerful I/O and graphics capabilities make Yorick a favorite tool for scientific numerical analysis. Machine-independent I/O, using the standard NetCDF file formats, simplifies moving applications between hardware architectures. Yorick is an interpreted language developed by David H. Munro at Livermore Labs. Implemented in C, it is freely distributed under a liberal copyright. Yorick runs on a vast range of machines, from 486SX Linux Laptops (in my case) to Cray YMP supercomputers.
Who uses Yorick? The majority of users are physicists, many with access to the most powerful computers in the world. Specific applications include Astrophysics, Astronomy, Neurosciences, Medical Image Processing and Fusion Research.
In this article I will discuss the basics of running Yorick, describe the key array operations, and briefly discuss array operations, programming and graphics. I hope that this quick look is enough to get the more mathematically inclined readers to give Yorick a try.
When invoked without arguments, Yorick presents a typical command-line interface. Expressions are evaluated immediately, and the result is displayed. Primitive types include integers, floating-point values and strings. All the built-in functions and constants you would expect to be present are present. Variable names are unadorned, with no leading $ character and need not be pre-declared. C-style comments are supported.
One might not expect an interpreted language to be suitable for numerical analysis, and indeed, this would be the case if arrays were not built into the language. Arrays are first-class objects that can be operated on with a single operation. Since the virtual machine understands arrays, it can apply optimized compiled subroutines to array operations, eliminating the speed penalty of the interpreter.
Arrays can be created explicitly:
> a1 = [1.1, 1.2, 1.3, 1.4, 1.5]
Elements can be accessed singly or as a subset, with 1 being the origin. Parentheses indicate the indexing operation, and a single index or a range of indices can be specified.
> a1
[1.1,1.2,1.3,1.4,1.5]
> a1(2)
1.2
> a1(1:3)
[1.1,1.2,1.3]
Since array operations are built into the language, functions applied to the array are automatically applied to all elements at once.
> sqrt(a1)
[1.04881,1.09545,1.14018,1.18322,1,2.23607]
Arrays are not limited in dimension. The rank (number of indices) of an array is not limited to one (a vector) or two (a matrix), but can be as large as desired. Arrays of rank 3 can be used to represent the distribution of a parameter across a volume, and an array of rank 4 could model this over time.
Yorick also provides a simple but effective help system. Executing the help command describes the help system. Executing it with a command name as an argument provides information on that command.
Yorick provides a complete programming language that closely matches C in terms of control flow, expressions and variable usage. For example, the statement:
> for(i=1; i<10; i++) { print,1<<i; }
will print the powers of two just as you would expect. Function declarations, introduced with func, also work as expected:
> func csc(x) {
> return 1/sin(x);
> }
There are differences—variables need not be declared, and arrays
are much more powerful than in C. The major difference is in
function invocation. Passing arguments to a function in parentheses
causes an evaluation and printing of the result; however, passing
arguments separated by commas simply executes the function and does
not return the result. Since in most cases intermediate results are
not required, many scripts contain function calls of the form f,x,y
rather than the more familiar f(x,y).
Having a programming language close to C allows easy migration between Yorick for prototyping and C for final implementation. However, as several Yorick users have indicated, moving to C is often unnecessary—the Yorick program proved to be fast enough to get the job done with a minimum of programming effort.
If C extensions are required, a straightforward framework allows extending the Yorick command language with whatever new operations are necessary.
Yorick has a compact and sophisticated mechanism for describing array indexing and operations, which are used to precisely specify the desired operation to the interpreter. Applying an operation to an array causes the operation to be applied to each element of the array. For example:
> a = [1,2,3,4,5]
> sqrt(a)
[1,1.41421,1.73205,2,2.23607]
What about multiplying two vectors? The default is to perform an element by element multiplication.
> b = [2,4,6,8,10]
> a*b
[2,8,18,32,50]
Those of you who remember physics or linear algebra will recall inner and outer products. The inner product is defined as the sum of the pairwise products:
> a(+)*b(+)
110
The outer product creates a matrix out of each possible multiplication:
> a(-,)*b(,-)
[[2,4,6,8,10],
 [4,8,12,16,20],
 [6,12,18,24,30],
 [8,16,24,32,40],
 [10,20,30,40,50]]
The + and - symbols, used where an index would be placed, are called special subscripts and provide precise control over how array operations are executed. The + is the matrix multiplication pseudo-index, which indicates to Yorick along which dimension the addition part of a matrix multiply should be performed. The - is a pseudo-index, creating an index where one did not exist before.
The rank-reducing operators sum, min, max and avg can be used in place of indices.
> a(max)
5
> b(avg)
6
One might wonder why this is necessary, when the equivalent function operators (i.e., min() or avg()) exist? The reason is that for matrices of rank 2 or greater, the rank-reducing index operators allow you to specify exactly how to perform the operation. For example, given a 3x3 array, do you want to average across rows, columns or the entire array?
> c = [[1,2,3],[4,5,6],[7,8,9]]
> dimsof(c)
[2,3,3]
> avg(c)
5
> c(avg,avg)
5
> c(avg,)
[2,5,8]
> c(,avg)
[4,5,6]
Here we have also introduced the dimsof() function operator, which reports the dimensions of the argument. In this case, the result tells us that c is an array of rank 2 with three elements in each direction.
Under Linux, Yorick is linked with the GIST graphics subsystem, allowing immediate display of plots and diagrams. Plots are interactive, allowing the user to zoom in and out, stretch axes, and crop the displays using the mouse. Yorick is capable of displaying sequences of plots over time as in a movie, and because of this, the command to prepare for a new image is fma or frame advance.
To plot the value of a function at evenly spaced points, we must first create the x values:
> x = span(0,10,256)
> dimsof(x)
[1,256]
x is now a 256-element array with values that range from 0 to 10.
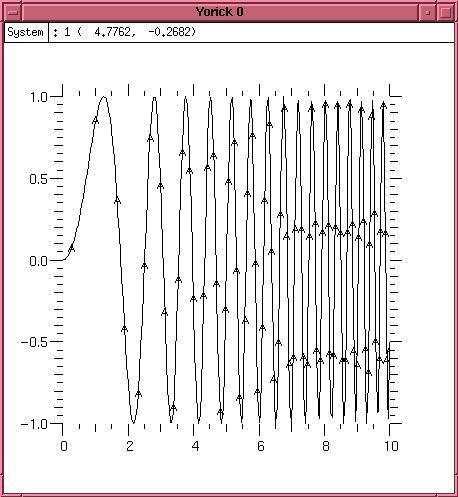
Figure 1. x-y Plot
The plg function, given vectors for the x and y values, plots x-y graphs.
plg, sin(x^2), x
The results of this command are shown in Figure 1. Note that the arguments are supplied y,x (not x,y). This allows Yorick to supply a default x vector (ranging from 1 to the number of y points), if desired.
Parametric plots are also supported. Consider the following commands which produced the spiral in Figure 2:
> window, style="vgbox.gs"
> a = span(0,20,256)
> x = a * sin(a)
> y = a * cos(a)
> plg, y, x
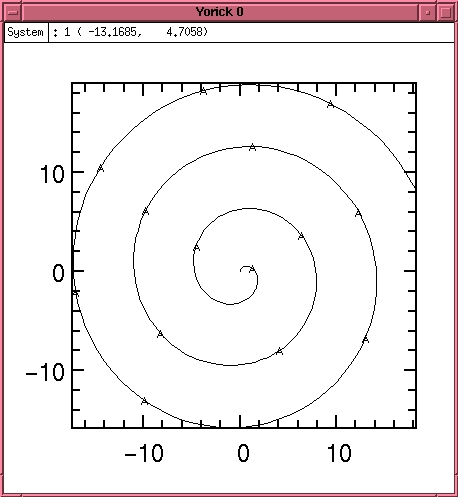
Figure 2. Spiral Plot
Surface plots are also available, either as a wire frame as in Figure 3:
> #include "plwf.i"
> orient3
> x = span(-pi,pi,32)(,-:1:32)
> y = transpose(x)
> fma
> plwf, sin(x)*cos(y)
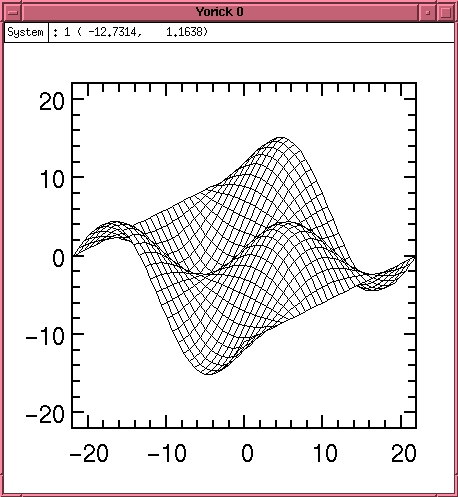
Figure 3. Wire Frame Surface Plot
Or a shaded surface rendition as in Figure 4:
> fma
> plwf, sin(x)*cos(y), shade=1, edges=0
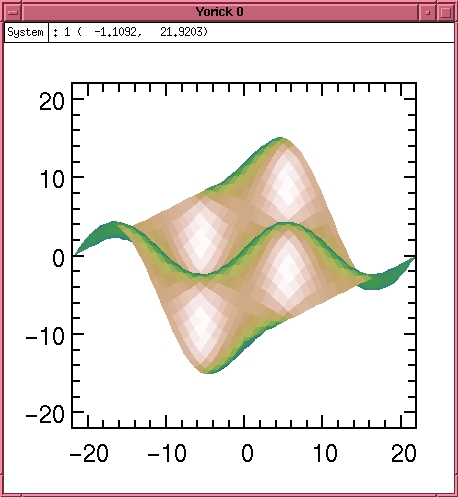
Figure 4. Shaded Surface Plot
A host of advanced graphics options are used in the demonstration programs distributed with Yorick, and the latest copy of the documentation has an extensive description of graphics options. In addition, libraries to read, write, and display PNM-format images are provided.
Yorick is an exceptionally rich environment for numerical analysis. Many of its capabilities such as file I/O, debugging, animation and distributed operation using MPY have not been explored in this article. Please take the time to read through the documentation and the example programs. You will not be disappointed.
This article was first published in Issue 26 of LinuxGazette.com, an on-line e-zine formerly published by Linux Journal.
Cary O'Brien (cobrien@access.digex.net) lives in Washington DC, and refers to himself, when pressed, as a “systems engineer”. He is currently Vice President of Optim Systems, Inc., which provides products and services to the telecommunications industry. He has been messing with computer hardware and software since high school. He is married with two children, 4 and 7, who are starting with computers even earlier.

