
Network Management & Monitoring with Linux
In today's world, where all the computing revolves around the concept of networking, the work for system administrators has become more and more overwhelming. It is the mission of maintaining the availability of resources such as routers, hubs, servers and every critical device in the network.
There are many reasons managers would like to monitor network devices: bandwidth utilization, operational state of links, bottlenecks, problems with the cabling or routing information distributed between its devices, etc. Monitoring network activity is also a good starting point for discovering security problems and misbehaviors.
In many cases, the network of an organization includes expensive links to remote networks (WAN) or the Internet, whose costs may be based on traffic volume. It's very important to maintain statistics of traffic going through these links. This is a very common task in Europe, where X.25 links are still very common. These links are charged on the basis of packets transmitted and received.
Other types of links, like Point to Point or Frame Relay, are usually charged on a flat rate. In these, the telco ensures a bandwidth that is important to monitor.
In the final part of this article we focus on a tool designed to monitor traffic in router interfaces, with a great graphical representation of this information. It can be easily modified to monitor other kinds of information.
The answer to all these needs is a protocol named Simple Network Management Protocol (SNMP). Designed in the '80s, SNMP's initial aim was to integrate the management of different types of networks with a simple design that caused very little stress on the network.
SNMP operates at the application level using TCP/IP transport-level protocols so it can ignore the underlying network hardware. This means the management software uses IP, and so can control devices on any connected network—not just those attached to its physical network. This also has disadvantages: if the IP routing is not working correctly between two devices, it's impossible to reach the target to monitor or reconfigure it.
There are two main elements in the SNMP architecture: the agent and the manager. It's a client-server architecture, where the agent is the server and the manager is the client.
The agent is a program running in each of the monitored or managed nodes of the network. It provides an interface to all the items of their configuration. These items are stored in a data structure called a management information base (MIB), which we explain later. It's the server side, as long as it maintains the information being managed and waits for commands from the client.
The manager is the software that runs in the monitoring station of the network, and its role is contacting the different agents running in the network to poll for values of its internal data. It's the client side of the communication.
There is a special command in the SNMP command set called trap that permits an agent to send unsolicited data to the manager, to inform it of events, such as errors, shutdowns, etc.
In essence, SNMP is a very simple protocol as long as all the operations it performs deal with the fetch-and-store paradigm, and this allows for a small commands set. A manager can perform only two different operations on an agent: request or set the value of a variable in the MIB of the agent. These two operations are known as get-request and set-request. There's a command to respond to a get-request called get-response, which is used only by the agent.
The extensibility of the protocol is directly related to the capability of the MIB to store new items. If a manufacturer wants to add some new commands to a device such as a router, he must add the appropriate variables to its database (MIB).
Almost all manufacturers implement versions of SNMP agents in their devices—routers, hubs, operating systems, and so on. Linux is not an exception to this, and publicly available SNMP agents for Linux can be found on the Internet.
SNMP provides very little support for authentication schemes. It supports only a two-password scheme. The public allows managers to request the values of variables, and the private allows these values to be set. These passwords in SNMP are called communities. Every device connected to an SNMP-managed network must have these two communities configured. It is very common to have the public community set to “public” and the private community to “private”, but it's very important to change these values to reflect the security policy of your organization.
SNMP defines a separate standard for the data managed by the protocol. This standard defines the data maintained by a device in the network and what operations are allowed on it. The data is structured in a tree form, and there is a unique path to reach each variable. This structured tree is called the Management Information Base (MIB) and is documented in several RFCs.
The current version of the TCP/IP MIB is MIB-II and is defined in RFC-1213. It divides the information a TCP/IP device should maintain into eight categories (shown in Table 1), and each variable included in this information must fall in one of them.
The MIB definition of a particular item also specifies the data type it can contain. Usually, items of an MIB can store single integers, but they can also contain strings or more complex structures, like tables. Items in an MIB are called objects. Objects are the leaf nodes of the MIB tree, but an object can have more than one instance—for example, a table object. To refer to the value contained in an object, you must add the number of the instance. When only one instance exists for an object, this is the 0 instance.
For example, the object ifNumber from category “interfaces” contains an integer with the number of interfaces present in this device, but the object ipRoutingTable from category “ip” contains the routing table of the device.
Remember to use the number of the instance to retrieve the value for an object. In this case, the number of interfaces present in a router can be viewed with the instance ifNumber.0.
In the case of a table object, you must use the index of the table as the last number to indicate a specific instance (row of the table).
There is another standard by which to define and identify MIB variables, called Structure of Management Information (SMI). SMI specifies MIB variables must be declared in an ISO formal language called ASN.1 that makes the form and contents of these variables unambiguous.
The ISO name space is within a global name space with other trees for other standards organizations. Within the ISO name space there is a specific tree for the MIB information. Within that MIB part of the tree are areas for objects from all protocols and applications so their information can be represented unambiguously.
Figure 1 shows the TCP/IP MIB name space is located just down the mgmt name space of the IAB. The hierarchy also specifies a number for each of the levels.
Figure 1. TCP/IP Organizational Tree
It's important to notice that most of the software needs the leading dot (root) to locate the object in the MIB. If you don't include the leading dot, it assumes a relative path from .iso.org.dod.internet.mgmt.mib-2.
This way the object ifNumber from category “interfaces” can be named:
.iso.org.dod.internet.mgmt.mib-2.interfaces.ifnumber
or its numerical equivalent:
.1.3.6.1.2.1.2.1and the instance as:
.iso.org.dod.internet.mgmt.mibxi-2.interfaces.ifnumber.0or its numerical equivalent:
.1.3.6.1.2.1.2.1.0Additional MIBs can be added to this tree as vendors create them and publish the suitable RFCs.
A new specification called SNMPv2 is being actively developed. It addresses the lack of security of the actual protocol with mechanisms that focus on privacy, authentication and access control. It also allows more complex specification of variables and has some additional commands. The problem with SNMPv2 is it still is not a commonly accepted standard, unlike SNMPv1. It is not easy to find SNMPv2 versions of the agents and software to take advantage of the new commands. Let's see what happens in the near future...
One of the most popular SNMP packages is CMU-SNMP. Originally designed by Carnegie Mellon University, it has been ported to Linux by Juergen Schoenwaelder and Erik Schoenfelder. It's fully compliant with the SNMPv1 standard and includes some of the new proposed functionalities of SNMPv2.
The distribution contains some manager tools that permit, in a command line style, send requests to devices running SNMP agents. It also contains an SNMP agent program, designed to run under Linux, that provides managers running on the network (or the same system) information about the status of the interfaces, routing table, uptime, contact information, etc.
One very valuable add-on that comes with CMU-SNMP is a SNMP C-API, which lets programmers build more complex management tools based on the networking capabilities of the distribution.
The installation on a Linux system is easy, but a little different from the original CMU distribution. The distribution comes with precompiled binary versions of the manager tools, the daemon and the API library.
First of all, you must decide whether to get the binary or the source distribution. It's easy to locate the package on the Internet (check the resources sidebar). The binary distribution runs cleanly with the 2.0 kernel series and is ELF-based. We will explain how to install the binary distribution. It's a good practice to get binary distributions only from trusted sites to avoid viruses, Trojan-horse style attacks and other security problems.
Put the file cmu-snmp-linux-3.2-bin.tar.gz in the root directory (/) of your Linux system and decompress it with the command:
gunzip cmu-snmp-linux-3.2-bin.tar.gz
Then, untar the distribution to its final location with the command:
tar xvf cmu-snmp-linux-3.2-bin.tarNow you will have all the utilities and libraries properly installed on your system, except the SNMP agent configuration file /etc/snmpd.conf. You can create it by running the script:
/tmp/cmu-snmp-linux-3.2/etc/installconfwith these options:
/tmp/cmu-snmp-linux-3.2/etc/installconf -mini <password>where password is the public community you want to use. Now you can edit the newly installed configuration file /etc/snmpd.conf. In it, you can change the values for the UDP port used by the agent, the systemContact, systemLocation and systemName variables and the interface speed parameters for your network cards and PPP ports.
The most important management tools you get are:
/usr/bin/snmpget A tool designed to ask for a concrete value in the MIB of an agent in the network (a router, a hub, etc.)
/usr/bin/snmpgetnext It allows you to get the next object in an MIB tree without knowing its name.
/usr/bin/snmpset A tool to set values in remote agents
/usr/bin/snmpwalk Tool that requests a complete object or series of objects without having to specify the exact instance. It's useful for requesting table objects.
/usr/bin/snmpnetstat
/usr/bin/snmptrapd Daemon that listens for traps sent by agents
/usr/bin/snmptest Interactive tool designed to demonstrate the capacities of the API.
The agent is located in the /usr/sbin/snmpd directory.
CMU-SNMP also installs an MIB file in /usr/lib/mib.txt. It's a good reference to search for information we can request from a device.
The agent must be run at startup time, and can be set up with this line in one of your system boot files (/etc/rc.d/rc.local, for example):
/usr/sbin/snmpd -f ; \
        echo 'starting snmpd'
Once you have the SNMP agent running for your Linux box, you can test it with one of the management tools, entering:
/usr/bin/snmpget -v 1 localhost \
        public interfaces.ifNumber.0
which will return the number of network interfaces configured in
the system, and:
/usr/bin/snmpwalk -v 1 localhost \
         public system
will return all the values in the system subtree of the MIB. (See
Figure 2 for the output of this
command.)
The C-API is located in /lib/libsnmp.so.3.1.
You can check the related header files as follows:
/usr/include/snmp/snmp.h
/usr/include/snmp/snmp_impl.h
/usr/include/snmp/asn1.h
/usr/include/snmp/snmp_api.h
and more information in the man pages snmp_api(3) and variables(5).
There's also a Perl extension module to interface with the CMU C-API that easily integrates calls to this library in Perl scripts.
MRTG is an advanced tool written by Tobias Oetiker and Dave Rand to graphically represent the data SNMP agents brings to SNMP managers. It generates nice HTML pages with GIF graphics about inbound and outbound traffic in network interfaces in almost real time. This abstracts the idea of dealing directly with objects of an MIB with a command line tool like CMU-SNMP. This is the simplest and most powerful tool to monitor my routers I have found on the Internet.
MRTG uses an SNMP implementation coded entirely in Perl, so there is no need to install other packages. The main program is written in C to speed up the logging process and the generation of GIF images. The graphics are generated with the help of the GD library from Thomas Boutell, author of the WWW FAQ.
One of the highlights of MRTG is its expandability and powerful configuration. It's very easy to monitor any SNMP variables instead of traffic, like error packets, system load, modem availability and others. It's even possible to import data from an external program to feed the data, so you can use it to monitor login sessions and other information not available through SNMP.
It comes with some tools to watch your router for interfaces, extract their characteristics and generate a base configuration file you can easily tweak to accommodate your needs.
Another interesting feature of MRTG is the amount of information it generates. It permits four levels of detail for each interface: traffic in the last 24 hours, the last week, the last month and a yearly graphic. This allows you to gather information for statistical purposes. It maintains an accumulated database with all this information with the help of a consolidation algorithm that prevents the data in the logs from eating up your disk space.
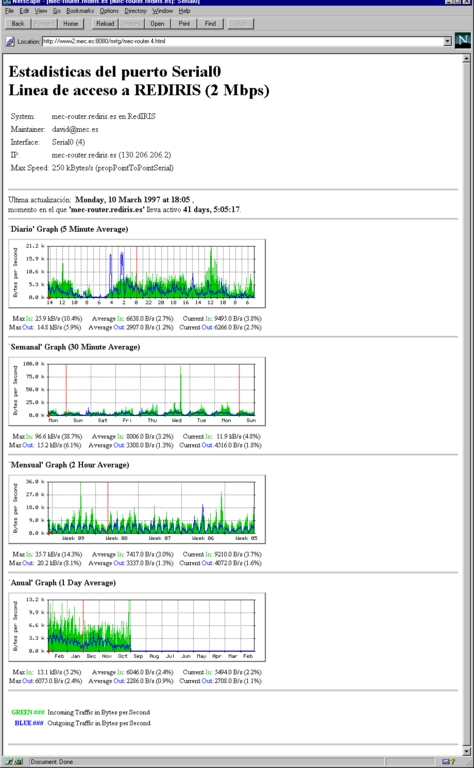
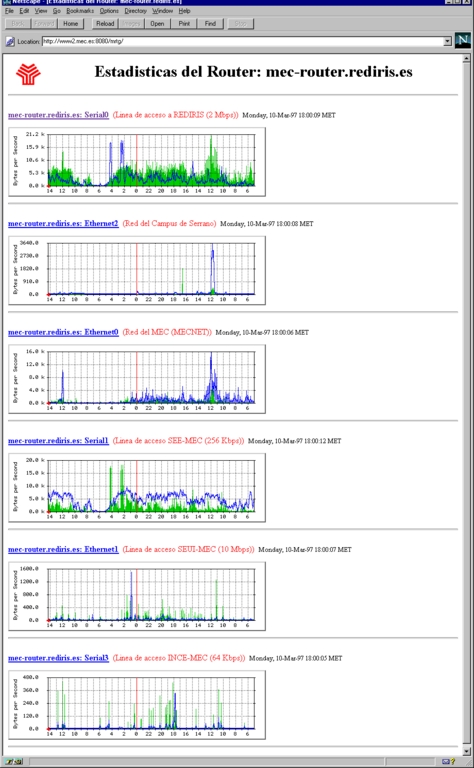
It also generates a main page that contains the GIF images of the daily details of every interface of a router, which lets you have a complete idea of what's happening in your router with a simple look. You can see the main page and a detail page generated by MRTG in Figures 3 and 4.
Figure 4. Interface Detail Page
Let's see a basic installation procedure. First of all, you need the distribution of MRTG. At the time of this writing, the latest version was 2.1; check the URL in the references sidebar for the latest version.
A package you must install before compiling MRTG is the GD graphic library. The URL is in the references sidebar, too. The current version of GD is 1.2, and you shouldn't have any problems compiling and installing it. Simply run make in the directory you unpacked the distribution and a file called libgd.a will be generated. Copy this file to /usr/local/lib and all the .h files to the directory /usr/local/include/gd.
At this point you should have GD up and running. Now is the time to build the MRTG package. Unpack the distribution, and edit the Makefile, indicating where to find the GD libraries and header files, and the Perl 5.003 binary—usually /usr/bin/perl or /usr/local/bin/perl. This is done through the variables GD_LIB, GD_INCLUDE and PERL.
Build the main program by typing make rateup, and when the compilation finished, enter make substitute to include the correct PATH to the Perl interpreter within the set of Perl scripts that MRTG uses.
Copy the following files to the final destination of the binaries (for example, /usr/local/mrtg): BER.pm, SNMP_Session.pm, mrtg and rateup. You can also copy to this location the two configuration programs, indexmaker and cfgmaker.
Ensure that all the programs have the execution bit set. Now we're ready to build a simple configuration file. At this point you should have SNMP read access to your router. In a Cisco router, the configuration lines to allow this are the following:
access-list 99 permit 193.147.0.8
access-list 99 permit 193.147.0.9
access-list 99 permit 193.147.0.130
snmp-server community public RO 99
This allows read-only requests from the addresses specified in the access list 99 using “public” as a password (community). If you want to allow every node in the network Read Only (RO) access to the router, you can have a line like this one:
snmp-server community public ROIf you have another brand of router, check the manuals to determine how to allow SNMP access to them.
The cfgmaker script greatly simplifies the task of building the configuration file. All you have to do is run it with the following arguments:
cfgmaker <community>@<router-host-name or IP>
For example:
cfgmaker public@mec-router.rediris.es > mrtg.cfgIt will discover every interface in your router and write a section in the file with its specifications of numbers of interfaces, maximum speed, description, etc, with some HTML tags to include them in the detail page. It's possible to edit this HTML layout to suit your language, preferences, etc. You can see in Figure 5 the output for one of the interfaces of my router.
Now you can run the mrtg program for the very first time. Simple execute:
./mrtg mrtg.cfg
If all goes well, it will contact your router, request some values, and generate some log files and several GIFs in the current directory. Don't worry about the complaints about the log and graphs not found, as this will happen only the first time. Remove the graphs and run the program again. The graph generated shows the traffic in the interval since you last ran the program. It also generates HTML pages for each interface.
Now it's time to instruct MRTG to run properly in your system. First, create a directory under the Document Root of your web server (assuming you run a web server on the same system) to accommodate the pages and graphs MRTG will generate each time it runs. Add this directory to the top of your configuration file with the directive WorkDir: /usr/local/web/mrtg (assuming that your Document Root is located in /usr/local/web). The next time MRTG runs, it will create the logs and graphs in this directory, allowing you to access them via http://your_host.domain/mrtg.
Now, you would like to build a main page for all the interfaces like the one shown in Figure 3. This can't be accomplished with the indexmaker tool. Run:
indexmaker mrtg.cfg <router-name regexp>  >
        /usr/local/web/mrtg/index.html
It will generate an HTML page with the daily graphs of interfaces whose router name matches the previous regular expression and links to their single detail pages.
As you can imagine the MRTG program must be run on a regular basis to collect the data for each interval and generate the graphs periodically, in order to maintain the illusion of real-time monitoring. This is done through the following line in the crontab (assuming /usr/local/mrtg-bin as the mrtg program final destination):
0,5,10,15,20,25,30,35,40,45,50,55 * * * *  \
        /usr/local/mrtg-bin/mrtg \
        /usr/local/mrtg-bin/mrtg.cfg  > \
        /dev/null 2>&1
In a Red Hat distribution, the correct line to append to the /etc/crontab file would be:
0,5,10,15,20,25,30,35,40,45,50,55 * * * *  root \
       /usr/local/mrtg-bin/mrtg \
       /usr/local/mrtg-bin/mrtg.cfg  >\
       /dev/null 2>&$
If everything is working fine, you can spend some time tuning your
configuration and HTML index page. A good enhancement is to include
in the <HEAD> section of the index page a <META .....>
to force the browser to reload every 300 seconds to maintain the
latest information on the screen.
Another enhancement you can include in your configuration file is the WriteExpire directive, which forces MRTG to create .meta files for each GIF and HTML page, eliminating unnecessary caching time by proxy servers and browsers. For this to work, you must also configure your Apache server (assuming you run the Apache web server) to read these .meta files and send the correct “Expire” headers with the MetaDir directive in the XXXX file.
You can look for additional directives in the example configuration from the distribution; it's very well documented. It's possible to alter all the layout of the images and pages generated by MRTG.
I hope you enjoy this program. If you do, send the authors a postcard; you can find their address on the MRTG home page.
There is a similar program called Router-Stats, written by Iain Lea, the author of the well-known tin news reader. Router-Stats updates its graphics once a day and shows very interesting stats about hourly usage and other aspects. One problem with Router-Stats is it uses a lot of external programs to do its work (CMU-SNMP for SNMP tasks, GNUPLOT to draw the graphics, NetPBM to make some graphic conversions, and GIFTOOL to convert them to the final GIFs). You can check the URL for Router-Stats in the references sidebar.
There is another category of software that goes one step beyond in network management tasks and offers a complete solution for both monitoring and maintaining the distinct configuration of a whole network. This kind of solution permits us to draw a complex graphic representation of our network and browse through the nodes, checking specific items of the configuration and other interesting features.
At this level, we can talk about two commercial solutions broadly used: HP-OpenView from Hewlett-Packard and SunNet Manager from Sun. They provide a complete platform for managing all the resources of the network from great graphical interfaces. They also come with network discovery tools to find all the network's elements that have running SNMP agents and databases to store all the data gathered from the network for statistical purposes. One important feature of these environments is their ability to be integrated with other vendors' more specific products, like Cisco's CiscoWorks, that allows a network manager to maintain a database with all its router configuration and even monitor graphically the back panels of their routers and all their connections.
There are two drawbacks to these products: they are commercial and they have no ports to Linux. Of course, there are also public domain solutions for these tasks. One of the best packages I've found for this is Scotty. Scotty is a TCL-based package that allows you to implement site-specific network management software using high-level, string-based APIs. Its companion product, Tkined, is a network editor that provides extensions to build a complete framework, integrating some tools designed to discover IP networks, support the network layout process or troubleshoot IP networks using SNMP in combination with other standard tools (e.g., traceroute). Scotty also includes a graphical MIB browser to allow you to explore MIB information.
You can check the references listing for both commercial and public domain network management software pointers.
SNMP is a simple but powerful protocol that can help us monitor our resources with little stress to the network. It's possible the extensions being developed now will increase the complexity and capabilities of this tool but they will also increase the resources needed to implement them.
In this article, we have explored a couple of tools found on the Net. There are a lot of tools being developed each day. You can check the Usenet newsgroup comp.protocols.snmp for announcements of new software and MIBS.


