
Real-Time Plots with kst and a Microcontroller
Lots of programs take data from a file and create an X-Y graph under Linux. Desktop applications like xplot, gnuplot or even PHPlot do a great job. But, what if you want to see how a physical process changes and use a real-time plot on your Linux machine?
I couldn't find this capability for a long time. Then, I discovered kst. kst is a fast, large-data set, real-time viewing and plotting program, and it's part of the KDE suite.
You need to have some way to get real-time sensor data into the kst program. I've used Arduino microcontrollers to automate different things, so it seemed only natural to combine one of these boards with kst to build an easy-to-use and very capable real-time data-gathering system. Because it's open-source-based, expansion and customization are possible.
In this article, I show how to link all the parts together to produce a real-time plot of live data and explain how to install and test kst. I also cover Arduino programming environment installation, so you can get the board programmed and stream data right into a Linux notebook.
kst can read text-based data from a file and has basic data analysis capabilities. As part of the KDE suite of applications, it is available on virtually all modern Linux distributions.
The easiest way to put kst on your machine is with your distribution's package manager. I used Synaptic under Xubuntu for the installation on my ASUS 64-bit Core Duo X83-VM notebook.
Once installed, kst appears under the Applications and Accessories pull-down tabs on the desktop taskbar.
Below is a small segment of some temperature and light-level data that I captured. The data snapshot will be used to test kst. Later, this same format will be used to stream real-time data from the Arduino into our Linux machine. Copy the data into a text file named testdata.txt:
74.64|444
74.64|448
74.64|452
74.64|450
74.64|447
74.64|439
74.64|435
Then start kst. The main kst window will show the task bar across the top and the kst QuickStart window in the middle.
Click on the Data Wizard button at the bottom of the Kst QuickStart pop-up pane. Figure 1 shows the kst toolbar, data source and configure data source windows. The pop-up Data Source pane will appear. Enter the data filename, testdata.txt. Press the Configure button. The Configure Data Source pane appears. Enter the custom delimiter character to separate the values in the data set. I used the vertical bar as a delimiter between the temperature and light-level values.
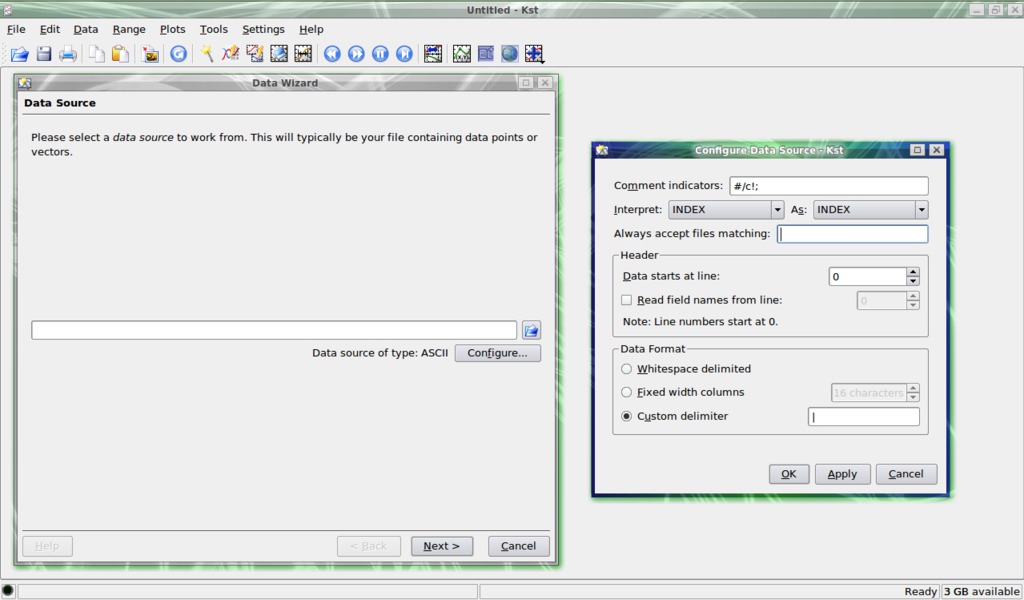
Figure 1. kst Toolbar, Data Source and Configure Data Source Window
Once the delimiter character is set, click the Apply then the OK buttons to save the settings and close the window. Click Next on the Data Source pane to bring up the Select Data pop-up window.
In the Data Source pane, hold down the Ctrl key and select numbers 1 and 2 in the left-hand pane. These correspond to the temperature (left) and light-level (right) values in the data file. Once selected, click the right-pointing arrow to copy the data streams to the right-hand pane. Using two data streams will give two separate graphs, one for temperature and one for light levels, referenced by a common line number. Temperature and light levels will appear on the y-axis, and the line numbers will appear across the x-axis on each respective plot.
Plot customization is done with several pop-up windows. Click anywhere on the top (temperature) plot label to bring up the Edit Plot pop-up window. Select the Appearance tab to edit the labels. kst assigns its own default labels. In my case, I changed the x and y labels to reflect the data that the plot was showing, namely the temperature, light levels and time interval. Modify the label fonts, font sizes, justification and other assorted options to your tastes. Other tabs under this window control how data is plotted on the x and y axes and the range of numbers displayed. Whenever you make a change on one of these tabs, be sure to click the Apply button then the OK buttons to save the changes.
This sets up a template for future runs with that data file. It doesn't matter if the file is static or grows over time. kst will start plotting what's in the file the next time the template is selected. Assign an appropriate name to the template file.
Now that you've installed and tested kst with a static data file, it's time to program the Arduino to sense the environment (temperature and light level), then stream the data out over the USB line to the notebook.
A simplified description of a microcontroller is that it's a small-footprint computer that can read and interpret input pin values, make a few calculations or decisions, and then control output pin signals based on the embedded program.
Arduino microcontrollers are known as open hardware. In the spirit of the open-source software tradition, the board designs, schematics and code are freely available to download, modify and enhance. The Arduino home page has active forums for information exchange, and there is a comprehensive set of reference documents.
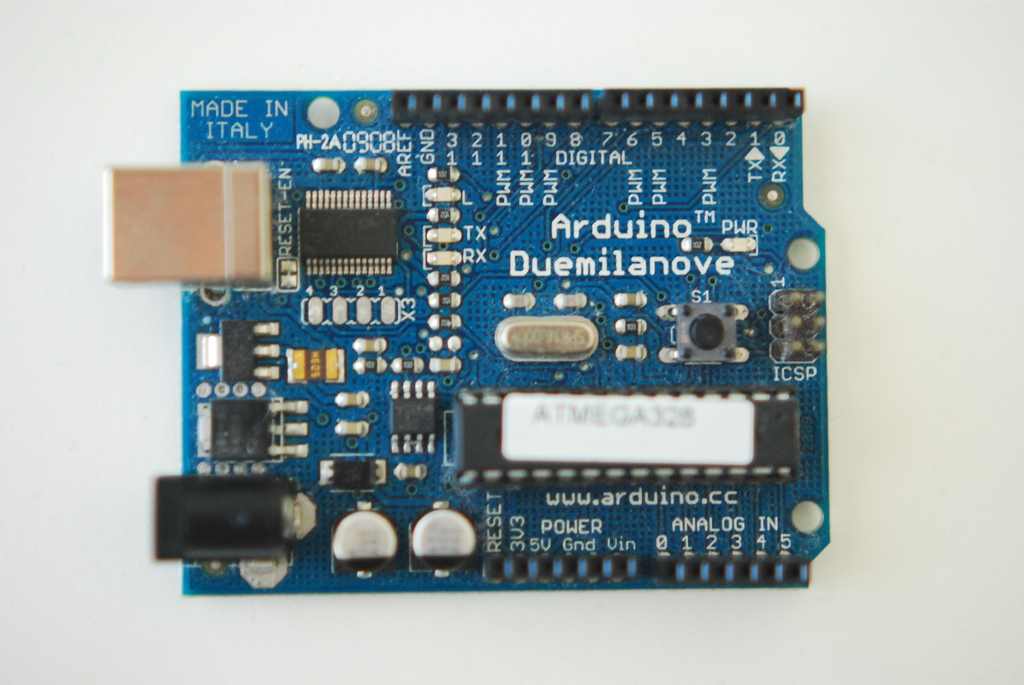
Figure 2. Arduino Board
Naturally, the boards and raw components cost money. A number of Arduino clones are available, offering board configurations for a variety of specialized applications. Prices for solder-it-yourself boards start at around $20. Complete ready-to-run boards with built-in USB interfaces cost about $30. You'll also need a breadboard, a few resistors, some jumper wires, a wall wart or battery and some sensors (suppliers are listed in the Resources for this article).
Inputs are either analog or digital. An analog device might be a potentiometer or photocell, while a digital device might be a magnetic reed switch or a push button.
Outputs control things. You could turn on a light with a digital output operating through a relay or transistor. In this article, we won't control anything with output pins. Instead, the Arduino will communicate sensor data to a Linux notebook, over the USB line.
Modern microcontroller modules, like the Arduino, take advantage of what's called in-circuit programming. The processor chip uses Flash memory for program storage and is accessed via the USB connection. Flash is a type of Electrically Erasable PRogrammable Read-Only Memory (EEPROM), which means it can be erased and rewritten multiple times using the proper electrical signals. These days, the term EEPROM normally is used only to refer to the more traditional type of EEPROM (which is still used in smaller sizes due to some of its other advantages). In-circuit programming is great because it minimizes equipment costs and prototyping turnaround time.
The flagship Arduino module is known as the Duemilanove. It is a 2.7" x 2.1" circuit board that has 14 digital I/O (input/output) pins and 6 analog input pins. It also has a built-in USB port, uses an Atmel Atmega 328 processor and screams along at 16MHz. Modules are powered by batteries or from a wall wart, with a recommended range of 7–12 volts DC.
Arduinos are programmed in a language called Processing. The Arduino integrated development environment (IDE) manages compilation of the Processing source code into machine code that is then uploaded to the Arduino board. Veteran programmers quickly will note Processing's remarkable similarity in format and syntax to the C language.
The Arduino IDE runs on 32-bit or 64-bit Linux notebooks and Netbooks. Obviously, Netbooks are cool because they are tremendously portable. Windows versions of the IDE are available. So, you'll always have the capability to program an Arduino, even if you get in a spot and don't have your Linux notebook close at hand.
Download the latest Arduino software from the Web site. Various Java packages, gcc-avr and avr-libc need to be installed, along with the Arduino integrated development environment. See Resources for a good tutorial on getting everything working in a 64-bit Ubuntu environment.
Open a terminal, and move to the directory where you installed the Arduino IDE. On the command line, start the IDE:
rreilly> ./arduino
The main Arduino code editor screen will appear. From the drop-down File menu, select New to get a blank code window. Type in your program. You also can copy code from another source, such as Web examples or from the sample code bundled with the IDE in the Examples directory.

Figure 3. Arduino IDE and Editor Window
The examples offer standard routines to read various input sensors and control output pins. The Arduino Web forums and reference pages contain all kinds of code snippets that you can use instead of having to write everything from scratch. Just like open source in the Linux world, Arduino users are encouraged to develop and share their code.
Listing 1. Source Code for This Project
#include <OneWire.h>
#include <DallasTemperature.h>

// Data wire is plugged into digital port 10 on the Arduino
#define ONE_WIRE_BUS 10

// Setup oneWire instance to communicate with OneWire temp device
OneWire oneWire(ONE_WIRE_BUS);

// Pass oneWire reference to Dallas Temperature
DallasTemperature sensors(&oneWire);

// Photocell input pin number
int potPin = 0;

// Declaration for photocell value
int val = 0;

// Arduino init functions
void setup(void)
{
  // Start serial port
  Serial.begin(9600);

  // Start up the library
  sensors.begin();
}

// Celsius to Fahrenheit conversion function
float c2f(float val){
  float aux = (val * 9 / 5);
  return (aux + 32);
}

// Main Arduino program loop
void loop(void)
{
  // Read photocell for light value
  val = analogRead(potPin);

  // Send command to get temperature from Dallas device
  sensors.requestTemperatures();

  // Convert returned C temp to F, print value
  Serial.print(c2f(sensors.getTempCByIndex(0)));

  // Print delimiter character in serial stream
  Serial.print("|");

  // Print (w/line feed) light-level value
  Serial.println(val);

  delay(1000);
}
After entering the code in a new file, select Save As under the File drop-down tab. Give your file a name that makes sense (in my case, simple_temp_f). The file will be saved in the Sketchbook directory with a .pde extension. Arduino source code files are called sketches, so, of course, that's where they are stored.
Once a program is entered and saved, you need to compile it. Under the Sketch tab, select Verify/Compile to produce the machine code. After a short period, a message noting the program size will appear in the status window at the bottom of the main editor window. Errors will show up highlighted in red. Most of my errors are usually typos or forgetting a variable declaration. As in C, don't leave out any semicolons.
Make sure the Arduino module is connected to the Linux notebook by the USB cable, and click the little upload button with the right-facing arrow on the toolbar. Some messages may appear in the status window at the bottom of the editor screen. Again, errors again will show up in red.
If you happen to be using an older version of the Arduino, such as the NG, you'll have to push the onboard reset button right before pressing the upload button to get the upload to start. There is a short upload window before the Arduino bootloader starts that is used to upload the program via the USB connection. Late-model Arduinos run a reset without the need for a manual button push.
In the middle of the Arduino module, the two onboard RX/TX LEDs will show that the machine code has been transferred from the notebook to the board.
The Arduino IDE and related programs are updated frequently, and I'm happy to report that version 0018 is much faster at compilation and uploading than version 0012. The speed increase goes hand in hand with the in-circuit programming capability. These steps minimize the program/compile/upload cycle and increases available prototyping time.
After the machine code is uploaded, the Arduino will perform a reset, and two seconds later, the bootloader will run the program and begin reading inputs and writing outputs.
You'll see the power LED light up, and if data is being sent over the USB (or optional serial line), the RX/TX LEDs will flash as data is moved back and forth.
The toolbar button in the very middle of the editor will open a new screen to view data coming in from the Arduino. It's called the serial monitor and is used to watch data transferred from the Arduino to the notebook. Note that the USB port on the Arduino is a USB-to-serial converter (an FTDI chip), so the Arduino shows up as a serial port on your computer.
Enough about Arduino programs. Let's link things together and make a real-time plot.
Figure 4 shows the circuit required to read the photocell and hook up the Dallas DS18B20 one-wire temperature sensor. The photocell produces changes in the voltage that is processed by one of the built-in analog-to-digital converters in the Arduino.
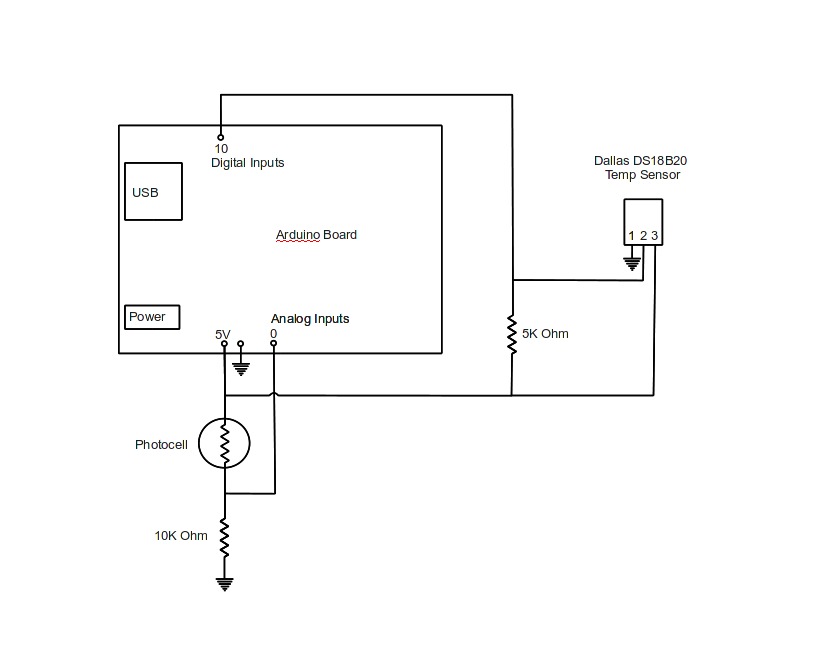
Figure 4. The Circuit Required to Read the Photocell and Hook Up the Dallas DS18B20 One-Wire Temperature Sensor
The Dallas sensor is a cool piece of technology, because a whole bunch of these sensors will work on a simple three-wire bus. Each sensor has a unique 64-bit device number. The Arduino code pings the Dallas sensors and receives a coded data stream from each one containing the device number and temperature reading. The Dallas sensor and one-wire libraries need to be added to the Libraries directory. Miles Burton built some awesome libraries and code; download them from his Web site (see Resources).
Code particulars are a little beyond the scope of this article. In a nutshell, the Arduino reads the photocell and temperature sensor values and converts them into a data stream, one line of data per program loop that is fed out over the USB port. Again, we don't change any output pins in this particular project.
Make sure the USB-serial port is configured to accept the data from the microcontroller. Open a terminal and use the stty command to set the baud rate for the port. If you have the wrong baud rate, you'll get funny characters that you can't read or import into kst:
rreilly> stty -F /dev/ttyUSB0 9600 clocal
Plug the USB cable in to the port, wait a couple seconds, and the Arduino will start sending data to your notebook. Use the cat command, in a terminal, to record the data to the testdata.txt input file:
rreilly> cat /dev/ttyUSB0 > testdata.txt
Stop the data stream with Ctrl-C.
Once you have the data coming in from the USB port, start kst to view it. Remember, you set up the kst template file earlier. Select your template file from the menu when kst starts.
The two graphs should appear, and the plot will change as data streams in. Scaling is automatic by default and will work for many situations (Figure 5).
That's pretty much the rundown on plotting real-time data with kst with an Arduino microcontroller and a Linux notebook. Explore the kst program for more display options.
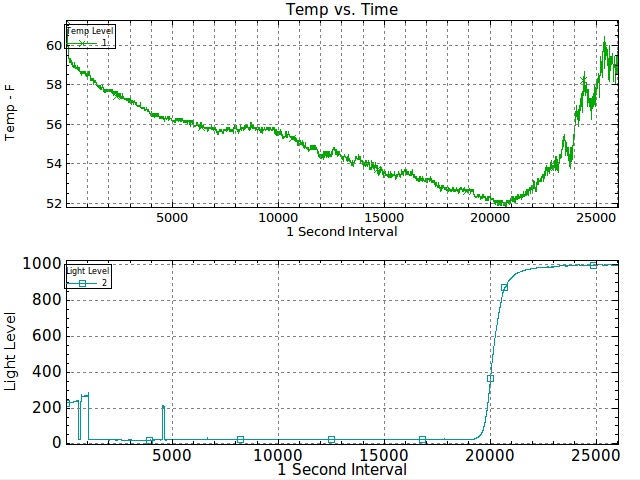
Figure 5. A Couple Live-Data Plots
This article looks at real-time data plotting with an Arduino microcontroller and the kst viewer program on a Linux machine. Use this system as the basis of a more advanced setup with multiple inputs and sensors. The system also might expand to include wireless or battery operation. I didn't talk about sending data to the Arduino from the Linux notebook, so perhaps that will be a topic for a follow-up article.
Resources
Arduino Home Page: www.arduino.cc
Arduino IDE Download Page: www.arduino.cc/en/Main/Software
The Arduino IDE on Ubuntu Tutorial: www.codetorment.com/2009/11/02/tutorial-getting-started-with-arduino-ide-on-linux-ubuntu-9-10
Miles Burton Dallas Temperature Sensor Libraries: www.milesburton.com/index.php/Dallas_Temperature_Control_Library
Sparkfun: www.sparkfun.com/commerce/product_info.php?products_id=666
Adafruit: www.adafruit.com/index.php?main_page=index&cPath=17
Maker Shed: www.makershed.com/ProductDetails.asp?ProductCode=MSGSA
Rob Reilly is a technology consultant, writer and portable computing expert. Early adopter tech trends, seminars and media projects are his stock in trade. Links to many of his published articles appear on his Web site at home.earthlink.net/~robreilly. Contact Rob at robreilly@earthlink.net.


